Download
1 / 5
110 likes | 162 Vues
FINANCE FOR EXECUTIVES Managing for Value Creation. Gabriel Hawawini Claude Viallet. IDENTIFYING AND ESTIMATING A PROJECT’S CASH FLOWS. EXHIBIT 8.1a: Data Summary of the Designer Desk Lamp Project. ITEM CORRESPONDING UNITS OR VALUE TYPE TIMING

E N D
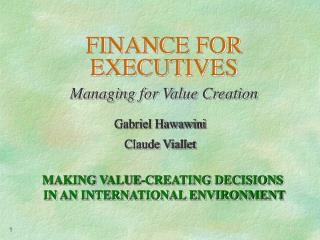
FINANCE FOR EXECUTIVES Managing for Value Creation Gabriel Hawawini Claude Viallet IDENTIFYING AND ESTIMATING A PROJECT’S CASH FLOWS
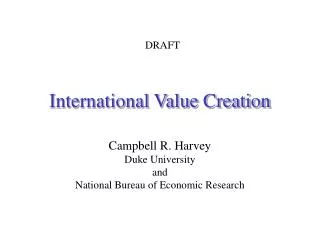
EXHIBIT 8.1a: Data Summary of the Designer Desk Lamp Project. ITEM CORRESPONDING UNITS OR VALUE TYPE TIMING 1. Expected annual 45,000; 40,000; 30,000; 20,000; 10,000 Revenue End of year 1 to 5 unit sales 2. Price per unit $40 first year, then rising annually at 3% Revenue End of year 1 to 5 3. Consulting $30,000 Expense Already incurred company’s fee 4. Losses on $80,000 Net cash loss End of year 1 to 5 standard lamps 5. Rental of building $10,000 Revenue End of year 1 to 5 to outsiders 6. Cost of the equipment $2,000,000 Asset Now 7. Straight-line $400,000 ($2,000,000 divided by 5 years) Expense End of year 1 to 5 depreciation expenses 8. Resale value of $100,000 Revenue End of year 5 equipment 9. Raw material cost $10 the first year, then rising annually at 3% Expense End of year 1 to 5 per unit 10. Raw material 7 days of sales Asset Now inventory
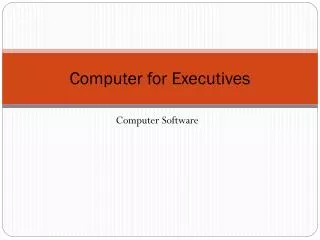
EXHIBIT 8.1b: Data Summary of the Designer Desk Lamp Project. ITEM CORRESPONDING UNIT OR VALUE TYPE TIMING 11. Accounts payable 4 weeks (or 28 days) of purchases Liability Now 12. Accounts receivable 8 weeks (or 56 days) of sales Asset Now 13. Work in process and 16 days of sales Asset Now finished goods inventories 14. Direct labor cost $5 the first year, then rising annually at 3% Expense End of year 1 to 5 per unit 15. Energy cost $1 the first year, then rising annually at 3% Expense End of year 1 to 5 per unit 16. Overhead charge 1% of sales Expense End of year 1 to 5 17. Financing charge 12% of the net book value of assets Expense End of year 1 to 5 18. Tax expenses on 40% of pretax profits Expense End of year 1 to 5 income 19. Tax expenses on 40% of pretax capital gains Expense End of year 5 capital gains 20. Aftertax cost of 10% (see Chapter 10) Not in the capital cash flow
EXHIBIT 8.2: Investment- and Financing-Related Cash-Flow Streams. TYPE OF CASH-FLOW STREAM INITIAL CASH FLOW TERMINAL CASH FLOW NPV at 10% Investment-related cash flows –$1,000 +$1,200 +$91 Financing-related cash flows +$1,000 –$1,100 Zero Total Cash Flows Zero +$100 +$91
EXHIBIT 8.4: Calculation of Net Present Value for SMC’s Designer Desk Lamp Project. Figures from Exhibit 8.3 Initial cash outlay CF0 =($2,360,000) Present value of CF1 = $832,000 × = $832,000 × 0.9091 = $756,371 Present value of CF2 = $822,000 × = $822,000 × 0.8264 = $679,301 Present value of CF3 = $692,000 × = $692,000 × 0.7513 = $519,900 Present value of CF4 = $554,000 × = $554,000 × 0.6830 = $378,382 Present value of CF5 = $466,000 × = $466,000 × 0.6209 = $289,339 1 (1 + 0.10)1 1 (1 + 0.10)2 1 (1 + 0.10)3 1 (1 + 0.10)4 1 (1 + 0.10)5 Net present value at 10% $263,293