Download
1 / 21
210 likes | 304 Vues
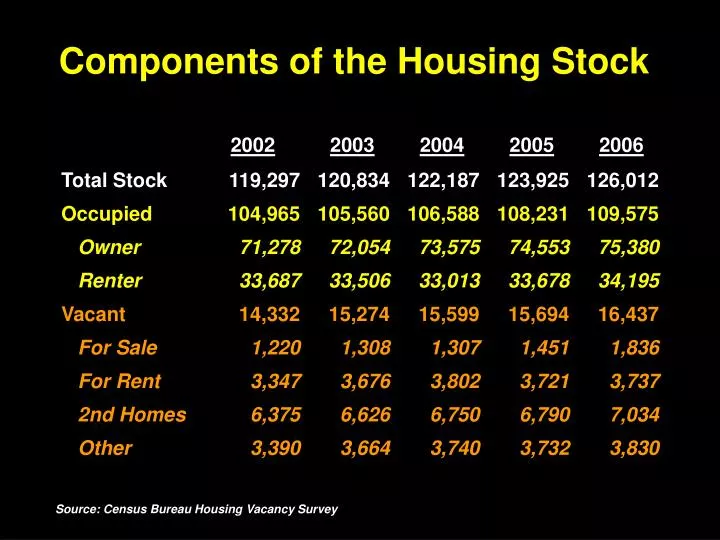
Components of the Housing Stock. Source: Census Bureau Housing Vacancy Survey. Live Births. 1946-64 Baby Boom. 1979- Echo Boom. 1965-78 Baby Bust. Data in Millions Source: HHS National Center for Health Statistics. Population Change by Age. Thousands.

E N D
Components of the Housing Stock Source: Census Bureau Housing Vacancy Survey
Live Births 1946-64 Baby Boom 1979- Echo Boom 1965-78 Baby Bust Data in MillionsSource: HHS National Center for Health Statistics
Population Change by Age Thousands Sources: Census Bureau and NAHB Long Term Forecast
Foreign-born Share of Population by Age2005 Current Population Survey (Census Bureau)
Mobility by Age: Moved in Previous 12 Months Source: Current Population Survey March 2004
Households With Second Homes by Age Survey of Consumer Finances (Federal Reserve Board)
Long Term Demand and Supply Source: Census Bureau, NAHB Forecast
2006: Chg in Employment v Starts/Pop • Excluding Louisiana
Rental Vacancy Rates 2004 US: 10.2% 0% to 8% 8.1% to 11% 11.1% to 13% 13.1% to 18%
Rental Vacancy Rates 2005 US: 9.8% 0% to 8% 8.1% to 11% 11.1% to 13% 13.1% to 15%
Rental Vacancy Rates 2006 US: 9.7% 0% to 8% 8.1% to 11% 11.1% to 13% 13.1% to 18%
Starts per Capita 2004 US: 6.6 10.0 or more 6.7 to 10.0 5.0 to 6.7 Less than 5.0
Starts per Capita 2005 US: 7.0 10.0 or more 6.7 to 10.0 5.0 to 6.7 Less than 5.0
Starts per Capita 2006 US: 6.1 10.0 or more 6.7 to 10.0 5.0 to 6.7 Less than 5.0
Starts per Capita 2007 US: 4.8 10.0 or more 6.7 to 10.0 5.0 to 6.7 Less than 5.0
Starts per Capita 2008 US: 5.0 10.0 or more 6.7 to 10.0 5.0 to 6.7 Less than 5.0
For more Housing Forecasts and In-Depth Analysis go toHousingEconomics.com