Download
1 / 35
350 likes | 454 Vues
October 22, 2013. Childhood Poverty and Lifelong Opportunity. www.cahs.org. Poverty in Connecticut: where we stand. Why the numbers are misleading. Why concentrated poverty matters. Policies and practices to break the cycle. Overview.

E N D
October 22, 2013 Childhood Poverty and Lifelong Opportunity www.cahs.org
Poverty in Connecticut: where we stand. Why the numbers are misleading. Why concentrated poverty matters. Policies and practices to break the cycle. Overview
If we look at the Kids Count profile of the state, Connecticut looks good. Doing really well on health, pretty well on education. Well above average on Community and Economic well being. Childhood poverty in Connecticut
Why is this relevant when talking about opportunity? States with high child poverty have less social mobility. By helping kids today, we have a state that creates more opportunities for all. Current poverty affects opportunity
An indicator to pay attention to: Concentrated Poverty Current poverty affects opportunity
Where you grow up has a huge effect on social mobility “The Equality of Opportunity Project” – Raj Chetty, Nathaniel Hendren, Patrick Kline, Emmanuel Saez Social mobility varies hugely by metro area in the U.S. Why is this relevant?
Social mobility, by metro area: Why is this relevant?
Researchers found is that the characteristics of the place you live in affects mobility. Why is this relevant? Positive factors Negative factors • Social capital • Two-parent households • Quality Schools • Income inequality • Income segregation by neighborhood: • All else being equal, upward mobility tended to be higher in metropolitan areas where poor families were more dispersed among mixed-income neighborhoods.
Why is this relevant? Barely any effect on social mobility • High taxes on wealthy • Racial composition • Tax credits • Number of wealthy people • Cost of higher education
A deeper look at our data: “Opportunity in Connecticut: The impact of Race, Poverty and Education on Family Economic Success” CT might have the schools and social capital, but income segregation is very high. What does this mean for Connecticut?
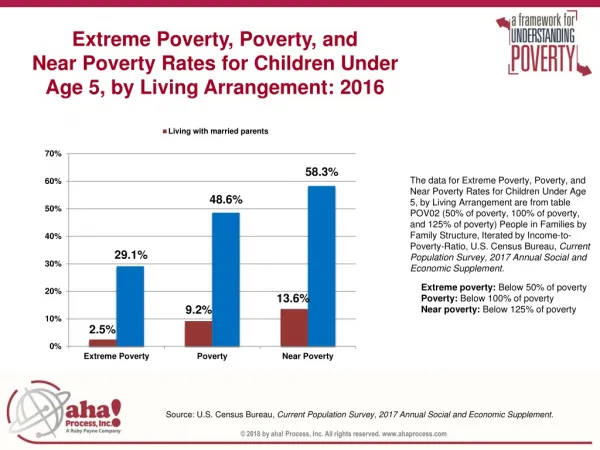
Not many poor, but very concentrated: Concentrated Poverty in CT
Not many poor, but very concentrated: Concentrated Poverty in CT
Concentrated Poverty in CT Hartford: an island of low opportunity surrounded by a sea of “progressive” communities.
A bit out of scope of this presentation, but here is a hint… Aside: how we concentrate poverty in CT?
Important factor to consider: A low income non-Hispanic white in Hartford has very similar social mobility to a low income Latino or Black Same with affluent Hispanics/Blacks in the suburbs. The issue is people of color tend to be poor, and tend to be concentrated in low income areas. Race and mobility
Concentrated poverty affects education… Race and mobility
Concentrated poverty affects education… Race and mobility
This translate to skills gaps… Race and mobility
Not just a city issue, though! Race and mobility
That is: racial inequality affects education outcomes Race and mobility
These outcomes extend to college… Race and mobility
And this translates to income, as well Race and mobility
And to assets: Race and mobility Source: Corporation for Enterprise Development, US Census Data
Children who are poor at birth are three times less likely to complete high school. Girls born poor are three times more likely to have a child as a teen. Only 1/3 of persistently poor boys will have consistent employment as adults. Only ½ of girls. Cumulative lack of opportunity
“Scarcity” by Sendhil Mullainathan, a Harvard economist, and Eldar Shafir, a psychologist at Princeton. Why the poor are less future-oriented than those with more money? Scarcity — not of money, but of what the authors call bandwidth: the portion of our mental capacity that we can employ to make decisions. Toxic stress and the cycle of scarcity
Low income families are forced to take decisions under stress constantly. They do so in communities without many choices. Concentrated poverty becomes self-reinforcing. Toxic stress and the cycle of scarcity
Connecticut is extremely unequal… Reminder
Ensuring Opportunity for All • What are the policy and program solutions? • Place: • Urban agenda to attract jobs, reform schools and taxes, and improve safety • Build affordable housing in suburbs and market-rate housing in cities
Ensuring Opportunity for All • Education: • Quality, accessible early education • K-12 reform: funding, integration, leadership, teaching; grade-level reading and HS graduation • Accessible, affordable post-secondary education
Ensuring Opportunity for All • Jobs, Income, and Wealth: • Make work pay with minimum wage, EITC; build job base and skills training • Facilitate access to SNAP, health and other benefits • Provide financial education and coaching
Opportunity in Action • Opportunities Hartford seeks “collective impact” to close opportunity gap; focus on jobs, education, income • “Integrated service delivery” at DSS and nonprofits: jobs, benefits, financial education • Result-Based Accountability: OUTCOMES
Conclusions • Connecticut is small in scale, wealthy • State on right policy track on education, health; work to do on jobs and place • All of us need to be engaged to create opportunity and better outcomes for all