Download
1 / 33
330 likes | 553 Vues
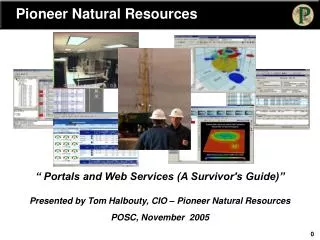
PIONEER NATURAL RESOURCES. IPAA London July 7, 2005. Forward-Looking Statements.

E N D
PIONEER NATURAL RESOURCES • IPAA London • July 7, 2005
Forward-Looking Statements Except for historical information contained herein, the statements in this presentation are forward-looking statements that are made pursuant to the Safe Harbor Provisions of the Private Securities Litigation Reform Act of 1995. Forward-looking statements and the business prospects of Pioneer are subject to a number of risks and uncertainties which may cause the Company's actual results in future periods to differ materially from the forward-looking statements. These risks and uncertainties include, among other things, volatility of oil and gas prices, product supply and demand, competition, government regulation or action, international operations and associated international political and economic instability, litigation, the costs and results of drilling and operations, Pioneer’s ability to replace reserves, implement its business plans or complete its development projects as scheduled, access to and cost of capital, uncertainties about estimates of reserves, quality of technical data, environmental and weather risks, acts of war or terrorism. These and other risks are described in Pioneer’s 10-K and 10-Q Reports and other filings with the Securities and Exchange Commission. This presentation does not constitute an offer of any securities for sale. Please see the Appendix to this presentation for certain definitions, reconciliations and other important information.
Successful Long-Term Strategy • Utilize long-lived legacy assets to anchor production and cash flow • Provide strong returns and sustainable per share production growth through: • Development of conventional and unconventional resources • Commercialization of recent discoveries • Exploration in high-potential, proven basins • Bolt-on acquisitions in core areas • Maintain strong financial flexibility and capital discipline Net Asset Value Accretion
A Distinctive Large Cap E&P • Creation of Long-Term Shareholder Value • Strong Balance Sheet & Cash Flow • Substantial Long-Lived, Low-Risk, U.S. Onshore Core Asset Position • Solid Exploration Track Record • Balanced Portfolio of Growth Opportunities
Company At A Glance • Represents reserves and pre-tax net present value discounted at 8% as of 12/31/04
Key Financial Metrics 2004 1Q’05 2005 Actual Actual Target • Proved Reserve Value ($B) $9.1(1) N/A N/A • Net Income ($MM) $313 $85 N/A • Discretionary Cash Flow ($MM) $1,231 $347 N/A • Capital Spending ($MM) $663(2) $286 $900 – 950(3) • Long -Term Debt ($B) $2.4 $1.8 ~$1.4 • Debt / Book 46% 42% ~30% • Debt / Proved Reserves ($ / BOE) $2.33 $1.79 ~$1.25(4) • Return on Equity 14% N/A >15% • Pre-tax 12/31/04 proved reserve value discounted at 10% • Excludes $2.5 billion associated with Evergreen merger • Represents 2005 capital budget; the Company does not budget for acquisitions • Assumes minimum of 150% reserve replacement during 2005
Low-Cost Leader • Effectively managing production and G&A costs while reducing cost of debt • Cash taxes represent <15% of total tax expense; expected to continue into 2007 5-Yr After-Tax Cash Cost Per BOE(1) % Change + + 2004 Cash Costs Per BOE (1) Per Howard Weil Equity Research: includes production costs, G&A, interest expense and cash taxes
Competitive Five-Year Reserve Metrics • Strong performance continues into 2005 with recently announced acquisitions replacing 100% of production at $2.53 per BOE • Expect to add additional reserves from development drilling and commercialization of existing discoveries Reserve Replacement F&D Cost *Reserve Replacement and Finding & Development Cost metrics per Howard Weil Equity Research
Proven Long-Term Performance (2000 – 2004) • U.S. production from core assets provided stable platform for growth • Exploration successes contributed to strong growth and value creation • Bolt-on acquisitions provided growth and future growth opportunities +390% Share Return +8% Production CAGR 40 70 35 60 30 50 25 40 Stock Price ($ per share) Production (MMBOE) 20 30 15 20 10 10 5 2000 2001 2002 2003 2004 Production Stock Price
Transformed Balance Sheet (2000 – 2004) • Optimizing balance between debt and equity led to solid debt adjusted per share performance over past 5 years • Reduced debt-to-book by 33% over past 5 years • Targeting debt-to-book of ~30% by year-end 2005 5-Year Debt Adjusted per Share Growth(1) PXD Production 16% Peer Average 12% PXD Reserves 18% Peer Average 14% PXD DCF 45% Peer Average 46% (1) Per UBS Equity Research (Peers include APA, APC, BR, CHK, DVN, EOG, KMG, NBL, NFX, PPP, and XTO); debt adjusted share count represents average debt divided by average share price plus average shares outstanding in the respective years
Cash Flow Generates Significant Growth Capital 2005 – 2006 Projected Capital Allocation(1) Commercialization 10% Exploration 15% Development 45% Acquisition 10% Growth Capital Free Cash Flow(2) 20% • Chart represents allocation of discretionary cash flow • Free cash flow represents capital available to Company stakeholders. See appendix for further Free Cash Flow disclosures
Low-Risk Drilling Opportunities • Multi-year inventory of over 6,000 locations • Increased development drilling in 2005 by 70% to capitalize on strong margins • Added over 3,000 locations during past 12 months through Evergreen and recent Spraberry and Pawnee area acquisitions Remaining Years of Inventory Identified Locations2,8002,200 70 800 300 100 30
U.S. Onshore Assets Drive Free Cash Flow Production (MMBOE)(1) Uinta Piceance Raton Hugoton West Panhandle Spraberry Net Operating Revenue vs. Capex ($MM)(1) Pawnee • Highly concentrated • Conventional, tight gas, CBM and other unconventional • Reserve life of over 20 years • Over 5,000 development locations • Over 500 wells to be drilled in 2005 (1) Pro forma Evergreen from 2003 forward (2) In accordance with U.S. GAAP, VPP volumes will not be reported in the Company’s future production and reserves, and are included in this graph for information purposes only
Accretive Bolt-On Acquisitions • Spraberry and Pawnee Area • June 2005 Acquisitions • Purchase Price $177 MM • Proved Reserves 70 MMBOE • 5-Year Development Capital $400 MM • Undrilled Locations 800 • Full Cycle Acquisition Cost ~$8.25 BOE • Production • Current ~1,800 BOEPD • 5-Year Potential >10,000 BOEPD • Minority interest in 80% wells prior to transaction • Leverage scale and drilling expertise in both areas Spraberry Pawnee Area Continuing to Pursue Additional Opportunities in U.S. Core Areas
Concentrated Growth Positions in Canada Chinchaga Coal Thickness (Meters) 10 – 18 4 - 8 < 4 PXD Leases Horseshoe Canyon Calgary • Chinchaga - completed 53 wells during winter drilling season • 13% increase in wells completed vs. 2004 • ~200 locations remaining • Horseshoe Canyon CBM - minimum 80-well program underway • ~61,000 gross acres • ~600 locations • Divestiture of non-core areas (Lookout Butte & Martin Creek) • Received U.S. $199 million in 2Q’05 • Sales price metrics: U.S. $23 per proven BOE; U.S. $71,000 per flowing barrel
Argentina Value Increasing Current PXD Gas Markets Govt. Regulated, Priority Consumers Argentina 25% Neuquen Buenos Aires 1Q’05 Realized Price per MCF 45% 1Q’03 30% Austral • 12% of proved reserves, 10% of capital • Expect 8% – 10% production growth in 2005 • Ranquilco Norte discovery ramping up to full production in 3Q’05 • Gas prices expected to double in 2005 relative to 2003 • Demand strengthening • Spot gas sales above $2.25 per MCF • Full price deregulation possible after 2006
Attractive Growth Portfolio Alaska • Oooguruk Discovery • NPR-A Lead Areas • Storms Lead Area Discovered Resource (MMBOE) 350 – 400 Exploration – Unrisked Potential (BBOE) 1.5 – 2.0 Canada / U.S. Lower 48 • Raton • Piceance and Uinta • Horseshoe Canyon CBM • Unconventional Gas • Gulf Coast Tight Gas Tunisia • Ordovician Gas • Silurian Oil Gulf of Mexico • Undeveloped Discoveries • Deepwater Subsalt • Deepwater Satellites • Shallow Shelf West Africa • Deepwater Nigeria / JDZ • Deepwater Equatorial Guinea Argentina • Conventional Gas • Enhanced Oil Recovery South Africa • South Coast Gas
Exploration Track Record (1999 – 2004) Historical High-Impact Exploration(1) # $B Discoveries 42 $1.9 Dry Holes 28 $0.3 Success Ratio 60% Value Creation(2) NPV $1.5B DROI 2.1 ROR 40% Future Value Creation Near-Term Value U.S. Unconventional / Tight Gas Alaska Satellites GOM Shallow Shelf Canada CBM North African Silurian Mid-Term Value Alaska Storms Area North Africa Ordovician GOM Deepwater Long-Term Value West Africa Deepwater Alaska NPR-A • Represents undiscounted actual and future capital expenditures (land, seismic, drilling and development) in Gulf of Mexico, Alaska, Tunisia, South Africa, Gabon and Equatorial Guinea; well count includes appraisal wells • Returns are pre-tax based on historical actuals and strip pricing as of June 2005, discounted at 10%
Significant Growth Opportunities in Alaska TAPS • OOOGURUK • PXD 70% WI (Op) • 53,000 acres • TOTAL PIONEER • 1.6 million acres Beaufort Sea BEAUFORT SEA TUVAAQ NIKAITCHUQ Anchorage MILNE POINT NORTHSTAR ALPINE ENDICOTT POINT THOMPSON • NPR-A LEAD AREAS • PXD 20-30% WI • 1.4 million acres PRUDHOE BAY 13 BBO KUPARUK RIVER 2.5 BBO BADAMI National Petroleum Reserve – Alaska (NPR-A) • STORMS LEAD AREA • PXD 50% WI (Op) • 130,000 acres • Lightly explored over past 20 years • Large, undeveloped discoveries • Long-lived oil reserves • Significantly improved margins • Excess TAPS capacity • Partnership with most active major – ConocoPhillips Why Alaska?
Actively Progressing Oooguruk Project 2006 – 2008 • Fabricate rig (2006) • Build gravel island (2007) • Install offshore buried pipeline (2007) • Begin development drilling (2007) • First oil (2008) Apr – Dec ‘05 • Moving project to go-forward decision: • Island, pipeline and rig design • Prepare FEED quality cost estimates • Permitting underway Jan – Oct ‘04 • Completed initial commercial evaluation: • Geologic modeling • Flow simulations • Facility scope and cost estimates • Drilling feasibility and cost estimates • Economic scenarios Winter ‘03 • Drilled 3 wells • Ivik well tested 1,300 BOPD from Nuiqsut formation Jan ‘04 • Secured farmout from COP on adjacent acreage
Balanced Approach in the Gulf of Mexico Canyon Express • Devils Tower Corridor • All 8 wells completed • Tie in Triton and Goldfinger late ‘05 • 2005: 4 deepwater and 3 – 4 shelf wells • Concentrated position in Mississippi Canyon around Devils Tower, Canyon Express and Thunder Hawk • Over 1.1 million total acres • Plan to acquire additional acreage as nearly 2,800 blocks expire in 2006 to 2008 • Paladin • Spud 3Q • Ozona Deep • Negotiating production handling contract • Thunder Hawk • Successful appraisal well • Falcon Corridor • Successful Raptor sidetrack • Clipper • Currently drilling Blocks under lease
Growing Production in North Africa • 5 – 10 wells planned per year • Over 5 million net acres • 7 successful wells drilled to date in Adam Concession • Producing ~19,000 BOPD gross • Commenced gas deliveries from Adam Concession • Expanding production capacity • Evaluating Ordovician discoveries on Anaguid block • Testing existing discoveries • Drilling exploration well in late July • Promising domestic gas market Tunisia Algeria Libya • El Hamra • PXD 50% WI (Op) Adam Concession Gross Production History 20,000 • Anaguid • PXD 45% WI Nour-1 • Jenin Nord • PXD 45% WI Adam-3 Hawa-2 • Adam Concession • PXD 24% WI Dalia-1 BOPD Hawa-1 • Borj El Khadra • PXD 40% WI Adam-2 Adam-1 0 May ‘03 June ‘05
South African Gas Project Nears Sanction • PXD 40% – 45% WI • 300 – 500 BCF of discovered gas in place • 8 – 10 well subsea tie-back to F-A platform • Expect to supply gas to synfuels plant for 6+ years • Currently re-injecting 90 MMCFPD from Sable • Gas price contract and final facility costs being negotiated • Drilling to commence in early 2006 with first sales mid-2007 Cape Town Mossel Bay Mossel Bay Synfuels Plant Block 9 ATLANTIC OCEAN F-A Pipeline to Shore Cluster E Cluster C Cluster A F-A Cluster B Sable Cluster D Block 9
Significant Reserve Potential in West Africa Lagos ERHA 500 MMBO OYO 60 MMBO Wari Nigeria BOSI 680 MMBO 320 Port Harcourt BONGA 735 MMBO NNWA/DORO 500 MMBO USAN 400 MMBO SW BONGA/APARO 800 MMBO NGOLO-1/2 250 MMBO ABGAM/EKOLI 780 MMBO Malabo AKPO-1 600 MMBO ZAFIRO 1,300 MMBO IKIJA-1 500 MMBO Equatorial Guinea 02 01 BOLIA/CHOTA 300 MMBO OPL256 04 05 03 06 07 08 09 H JDZ Sao Tome and Principe JDZ Block 1Chevron / Exxon to spud in 2006 • Expect to drill 8 exploration wells from 2005 – 2007 • Nigeria • Block 320, technical operator • PXD 51% WI • 440,000 acres • Acquiring 3-D seismic • 1st well in 2006 • Block OPL 256 • Awaiting government approval • Drilling well in late ‘05 • Joint Development Zone • Accepted exploration rights on Blocks 2 and 3 • Negotiating JOAs and PSCs • Equatorial Guinea • Block H • PXD 50% WI • 400,000 acres • Drilling well in late ‘05 / early ‘06 • High chance of success • Large reserve potential • 1 – 2 BBOE of gross unrisked program potential Why West Africa?
Pioneer’s NAV Exceeds Current Stock Price After-Tax Net Asset Value(1) • Net Asset Value Per Share $55 - $60 • Proved Reserves • Discovered Resources • Recent Share Price Range $40 - $45 ~ $15 per share Continue share repurchases to capture discount to NAV • Repurchased 5.4 MM shares during past two quarters, or ~6% shares outstanding • Authorized $300 MM program in January; completed $152 MM through 1Q • Plan to seek authority for additional $300 MM authorization later this year (1) After-tax NAV is calculated using strip commodity prices as of June 2005 and includes proved reserves and discovered resources (risked probable reserves and yet-to-be developed commercial discoveries) as of 12/31/2004 discounted at 8%. NAV does not include the impact of the three VPPs completed during 2005, asset divestitures and asset acquisitions announced in 2005, possible reserves and upside associated with Pioneer’s exploration portfolio. See appendix for further NAV disclosures.
Enhancing Long – Term Shareholder Value • Long-lived legacy assets provide platform for growth • 80% of proved reserves • Highly concentrated and essentially 100% operated • Significant excess cash flow • Wealth of opportunities • Over 6,000 development locations • 350 – 400 MMBOE of unbooked discovered resources • 1.5 – 2.0 BBOE of unrisked exploration potential • Strong balance sheet • Returning capital to shareholders
Certain Reserve & Production Information The U.S. Securities and Exchange Commission (the “SEC”) permits oil and gas companies, in their filings with the SEC, to disclose only proved reserves that a company has demonstrated by actual production or conclusive formation tests to be economically and legally producible under existing economic and operating conditions. Pioneer uses certain terms in this presentation, such as “probable” and “possible” reserves, “discovered resources”, “exploration potential” or other descriptions of volumes of reserves potentially recoverable through additional drilling or recovery techniques that the SEC’s guidelines prohibit Pioneer from including in filings with the SEC. These estimates are by their nature more speculative than estimates of proved reserves and accordingly are subject to substantially greater risk of being actually realized by Pioneer. Pioneer’s production forecasts are dependant upon many assumptions, including estimates of production decline rates from existing wells and the outcome of future drilling activity. Also, Pioneer’s internal estimates of reserves, particularly those in its proposed acquisitions, where Pioneer may have limited review of data or experience with the properties, may be subject to revision and may be different than those estimated by Pioneer and audited by its independent reservoir engineers at year-end. Although Pioneer believes the expectations, estimates and forecasts reflected in these and other forward-looking statements are reasonable, it can give no assurance that they will prove to have been correct. They can be affected by inaccurate assumptions and data or by known or unknown risks and uncertainties.
Non-GAAP Financial Information This presentation contains disclosure of discretionary cash flow (“DCF”) and free cash flow, which are “non-GAAP financial measures,” as defined in SEC rules. DCF equals cash flows from operating activities before changes in operating assets and liabilities and before cash exploration expense. Free cash flow equals DCF minus capital expenditures. DCF and free cash flow are presented herein because of the wide acceptance of those measures by the investment community as financial indicators of a company's ability to internally fund exploration and development activities. Pioneer also views the non-GAAP measures of DCF and free cash flow as useful tools for comparisons of Pioneer's financial indicators with those of peer companies that follow the full cost method of accounting. DCF and free cash flow should not be considered as alternatives to net income or other cash flow presentations, as defined by Generally Accepted Accounting Principles (“GAAP”). For reconciliations of the GAAP measures of Net Income and Net Cash Provided by Operating Activitiesto DCF, please refer to the Pioneer press releases entitled “Pioneer Reports First Quarter 2005 Results,” dated May 3, 2005, and “Pioneer Reports Fourth Quarter 2004 Results, Reaches Record Production,” dated February 8, 2005, located in the News Releases section of the Investor Relations page at the www.pioneernrc.com website.
Net Asset Value Disclosure Although Pioneer does not consider “Net Asset Value” and “Net Asset Value Per Share” to be “non-GAAP financial measures,” as defined in SEC rules, Pioneer uses Net Asset Value as an estimate of fair value and also as one of the measures of management performance. Net Asset Value and Net Asset Value Per Share should not be considered as alternatives to PV10, Stockholders Equity or per share statements of those measures.Pioneer’s NAV calculation is based on numerous assumptions that may change as a result of future activities or circumstances. Pioneer calculates Net Asset Value as pre-tax net present value of proved reserves and discovered resources (risked probable reserves and yet-to-be developed commercial discoveries) plus other tangible assets adjusted for working capital minus long-term debt and other liabilities including future income taxes and the impact of existing hedge positions.