Download
1 / 57
570 likes | 647 Vues
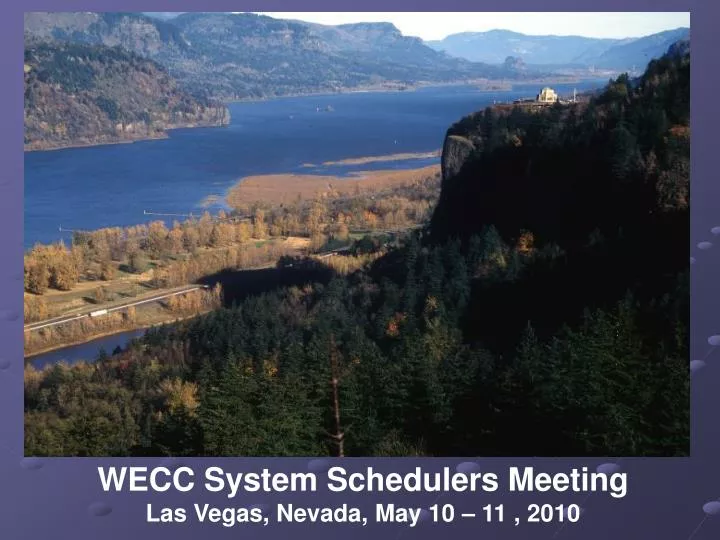
WECC System Schedulers Meeting Las Vegas, Nevada, May 10 – 11 , 2010. NW Hydro Operations Francis Halpin – Bonneville Power Administration. Hydrology 101. The Columbia River Basin. Climatological zones range from high deserts to mountain ranges Elevation ranges from 300ft to over 10,000ft

E N D
WECC System Schedulers Meeting Las Vegas, Nevada, May 10 – 11 , 2010
NW Hydro Operations Francis Halpin – Bonneville Power Administration
The Columbia River Basin Climatological zones range from high deserts to mountain ranges Elevation ranges from 300ft to over 10,000ft Impacted by Pacific Ocean as well as continental influences Adiabatic Lift
Hydrology 101Hydrographs • A hydrograph is a representation of flow for a particular stream and is used to evaluate the watershed runoff volumes and the peak flow rates from a single storm or set of storms. This information is then used in the design of flood control facilities. Watershed runoff is a function of several things, including: • rainfall intensity • storm duration • type of vegetation in the watershed area • size and shape of the watershed
Hydrology 101Hydrographs • Unit Hydrograph • The unit hydrograph depicts the response of the watershed from a unit (typically 1 inch) of excess rainfall uniformly distributed over the watershed at a uniform rate during a given period of time • Unit hydrograph can be used to predict the response of the watershed for any given rainfall distribution. • Unit hydrograph can be used to predict flood peaks within 25% of observed values (i.e. sufficient for planning)
Hydrology 101Hydrographs • Storm or Flood Hydrograph • Based on actual rainfall distribution and actual streamflow response • Plots actual runoff from a particular storm • Can be used to fine tune unit hydrograph.
Hydrology 101 • ANNUAL HYDROGRAPH • Annual streamflow hydrograph is a plot of streamflow versus time over a year or more • Annual hydrographs show the long-term balance of precipitation, evaporation, and streamflow in a • watershed • In addition, annual hydrographs depict the temporal variability of streamflow
Hydrology 101 SUMMARY HYDROGRAPH Summary hydrographs are a family of graphs which show, for each day of the calendar year, the maximum, minimum, various percentiles, etc. for the basin of interest over some period of record. Any point can come from any of the years of record. Easier to read than 50 traces of 50 different water years.
HydrologyNatural versus Actual flow hydrographs Natural Flow – The flow which the basin would experience IF there were no dams. Actual or Regulated Flow – the flow actually observed in the basin. In a watershed with storage dams there is opportunity to store water from year to year or to release water stored from prior years. The change in storage is the major difference between natural flow and regulated flow.
HydrologyColumbia River Basin Where does the water come from? (as a percent of the annual runoff at The Dalles) 61% 27% 12%
119 Years of Actual January-July Volume Runoff at The Dalles for 1879 through 2001 190.0 180.0 170.0 160.0 Yearly Jan-Jul Volume Runoff 150.0 5 yr Moving Average 140.0 130.0 120.0 110.0 100.0 90.0 80.0 70.0 60.0 50.0 40.0 1879 1889 1909 1929 1959 1904 1919 1939 1949 1969 1979 1894 1899 1999 1914 1954 1984 1989 1924 1974 1944 1964 1994 1884 1934 Observed Flow for 1879-1928 Adjusted Flow for 1929-2001 Columbia River Annual Runoff Variability
OK We have all this water – what are we going to do with it all? Lets Build some dams. Rock Island Dam – 1932 1930’s – 1st of two federal dam building eras. Bonneville – 1938, Grand Coulee – 1941
OK We have all this water – what are we going to do with it all? Lets Build some dams. Vanport Flood - 1948 1950’s and 1960’s – 2nd of two federal dam building eras. Canadian Treaty Large Storage Projects California Intertie
PNW Hydro Characteristics • Common fuel supply, affected by non-power constraints • Hydro operations have consequence,either immediately or in the future • Hydro is used for regulation and load-following while thermal tends to be base loaded 4,000ft 3,500ft United States – Canada Treaty and Columbia River Base System Projects 3,000ft Treaty Project Dam in Canada Base System Federal Project Base System Non-Federal Project NOTE: FOR ILLUSTRATIVE PURPOSES; NOT ALL PROJECTS ARE SHOWN 2,500ft Hungry Horse So. Fork Flathead River Kerr 2,000ft Flathead River Thompson Falls Libby Mica 1,500ft Noxon Rapids Coeur d’Alene Lake Feet above Sea Level Cabinet Gorge Clark Fork River Duncan Lake Albeni Falls Brownlee Box Canyon Kootenay River Kootenay Lake 1,000ft Oxbow Pend Orielle River Arrow Lakes Spokane River Grand Coulee Snake River 500ft Chief Joseph Columbia River Wells Rocky Reach Chelan Rock Island Wanapum Ice Harbor Priest Rapids McNary The Dalles John Day Sea Level Bonneville OCEAN 100 200 300 400 500 600 700 800 900 1000 1100 1200 Miles from River Mouth
The Need for Coordination in the PNW Agreements • Columbia River Treaty • Yearly / Monthly regulation • Pacific Northwest Coordination Agreement (PNCA) • Yearly / Monthly regulation • Mid Columbia Hourly Coordination Agreement (MCHC) • Daily / Hourly regulation • Northwest Power Pool (NWPP) • Reserve Sharing Program • Hourly / within-hour
The Need for Coordination in the PNW Agreements • One utility principle – determine the optimum power operation within the bounds of non-power constraints as if operated by a single entity; a MW is a MW regardless of location. • Power optimized on a monthly basis by directing the amount and timing of storage releases at specific reservoirs. • Coordination will be safe for all parties • Recognize autonomy of owners to operate their resources for their own needs while providing certainty to other coordinated parties (using obligations for energy exchanges based on theoretical optimum hydro operation). • Since power benefits are independent of location, requirement for sufficient transmission capacity to make coordination work.
The Need for Coordination in the PNW • Pacific Northwest Coordination Agreement • Methods of making Parties whole • In Lieu • Provisional Draft • Storage • Interchange • Mid Columbia Hourly Coordination • BPA • Grand Coulee (BoR) and Chief Joe (Corps) • Wells (DOPUD) • Rocky Reach and Rock Island (CHPUD) • Wanapum and Priest Rapids (GCPUD) • Many other utilities both public and private are also members • Northwest Power Pool • Operating Committee • Reserve Sharing Group • 19 Balancing Authorities – Canada, PNW and California
Coordinating with Federal Partners • Corps of Engineers • Willamette River Plants • Headwater Projects • Outages • Special Operations • Bureau of Reclamation • Outages • Special Operations • Pumping Operations and Banks Lake
Coordinating with Other Parties • Fishery Operations • Technical Management Team (TMT) • Weekly Operations • Special Operations • Hatchery release timing and required spill • Seasonal use of available water • Use of storage space versus flood control • Conflicting constraints • Flood Control below the fish VECC results in a flat operation with no ability to draft below FC.
Putting the Daily Plan Together Headwater Projects (storage) Libby, Dworshak, Hungry Horse Planned weeks to months ahead Drafting to FC – Refill rate End of month target elevation Actual Schedules depend on inflow Willamette Projects Flows determined by Corps Some shaping on the Storage project is available as long as the Re-Reg keeps enough flow to run at the required flow.
Putting the Daily Plan Together The Big Ten • Mid Columbia • Grand Coulee • Chief Joseph • Lower Snake • Lower Granite • Little Goose • Lower Monumental • Ice Harbor • Lower Columbia • McNary • John Day • The Dalles • Bonneville
Scheduling the “Big 10” BPA has optionality on the scheduling of these “Big Ten” projects. The majority of load following and “dispatchable” reserves are carried on these 10 projects. These are the focus of BPA’s hydro generation scheduling group.
Scheduling the “Big 10” The optionality is bounded by physical limitations and constraints at the projects and by mandated hydraulic objectives like flood control and fishery requirements. Much of the year the constraints and hydraulic requirements are so prescriptive that we have little optionality or flexibility.
Scheduling the “Big 10” Planning and modeling is done days to weeks in advance in order to plan for marketing necessary to adjust load to meet hydraulic objectives. On the preschedule day, generation “schedules” are produced by the models. They are sent to the TOP for planning purposes. The actual scheduling of the Big 10 generation does not really occur until hour ahead; just prior to the WECC interchange ramp. We have over 2,000 MW of contractual uncertainty up until XX:30 each hour and normal load uncertainty beyond that. And once we get into the hour there is wind !
Scheduling the “Big 10” • Meeting load obligations requires not only capacity but having the fuel in the right place at the right time. Complex task. • Load variability (Peaking contracts, SLICE, BPA marketing) • Final Load is not know until XX:40 (or later) • Lag Times do not always verify • No water = no generation (limited to inflow only) • Unplanned outages • Wind – BPA has over 2,700 MW’s of wind in BA • Within hour disruption of scheduled gen = disruption of future hour fuel supply downstream • Persistent Imbalance disrupts operation over longer periods.
Germany Denmark
Dispatcher Standing Order 216 Public Rate Setting Process on Wind Balancing Rate R.O.D. set rate based on meeting 99.5% of events based on statistical study and methodology. In order to assure ramping events are covered, BPA holds 835 MW of INC (upward) reserves 1035 MW of DEC (downward) reserves Wind fleet pays for the service through the rate. When extreme events cause the wind balancing reserves to be depleted DSO 216 measures are enacted. Plants are sent signals to feather or otherwise reduce generation to schedule OR to curtail e-tags depending.
Scheduling Hydro Under Uncertainty ~3,500 MW of contractual and wind uncertainty, differing project constraints - characteristics - lag times - reservoir factors - H/K - TW limits, etc. make managing the fuel supply a complex problem.