Download
1 / 31
310 likes | 312 Vues
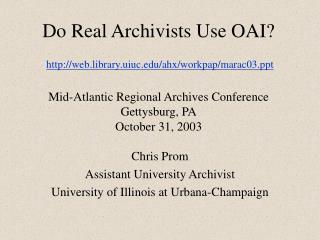
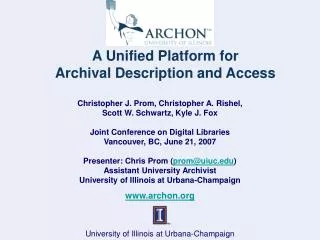
Improving the User’s Experience through Web Analytics* SAA Research Forum Chicago, Illinois August 28, 2007. Christopher J. Prom Assistant University Archivist University of Illinois at Urbana-Champaign prom@uiuc.edu. *Special thanks to Beth Yakel, Aprille McKay, and Helen Tibbo!.

E N D
Improving the User’s Experience through Web Analytics*SAA Research ForumChicago, Illinois August 28, 2007 Christopher J. Prom Assistant University Archivist University of Illinois at Urbana-Champaign prom@uiuc.edu *Special thanks to Beth Yakel, Aprille McKay, and Helen Tibbo!
What is Web Analytics • Web Measurement: gathering and parsing the data • Web Analytics: interpreting measurement reports so that some action can be taken – Eric T. Peterson, Web Site Measurement Hacks, p. 3 • “the measurement, collection, analysis and reporting of Internet data for the purposes of understanding and optimizing Web usage”--Neil Mason, “The Four Parts of Web Analytics,” http://www.google.com/analytics/cu/ac_the_four_parts.html
Why use it? • Most archival user study involve intervention or surveys/interviews • Both are useful • But. . . • All interventions affect behavior • What people say they do is notoriously inaccurate • Allows unobtrusive observation of actions (NOT motives or initiative) • May provide basis for action or further study Daniel Russell, regarding Google’s Eyetracking studies: “people behave differently here, they want to make researcher happy, have been given a free lunch”
Internal Log Data 138,041 hits on collection records 117,468 hits on search page 14,210 hits on “browse by provenance” (12,737 non-staff) 6,721 hits on “browse by digital content” 2,287 hits on “browse by subject” 1,855 hits on full finding aid 1,255 hits on “browse by title” 449 hits on “PDF/Deep Search”
Step 1: Analyze—Overview of UIUC ‘non-virtual’ use in 2005/06
Structure Facilitate Contact Provide Descriptive Information About us; Link to Programs Mediate use Promote Services Step Two—Understand: Current Website Structure/Purpose • Archival Website Goals: • Provide information on services? • Provide access to descriptive information? • Drive on-line or on-site use? • Facilitate research, service, learning? • (Developing Archival Metrics http://www.si.umich.edu/ArchivalMetrics/ ) More Complex
Step Three—Inform: Develop a Privacy Policy • Google http://www.google.com/analytics/tos.html • COLLECTS what they term “anonymous traffic data” (includes IP Address) • REPORTS summary information only • Requires use of a privacy policy • UIUC Archives http://web.library.uiuc.edu/ahx/about/privacy.php
Step 4—Plan and limit scope:What I tried to measure • Q1:How do people get to our site? • Q2: What are the most popular pages/groups of content? • Q3: What are most popular searches? • Q4: How do users move through the net and our site toward 4 ‘goals’? • Use search form • View record series description • View full finding aid • Send email Better
My ‘Goal Conversion Funnel’ User enters site after Google Search - or - Caveat: Does not include direct ‘hits’ via Google, or other external referrers Caveat: Does not include emails sent directly to the address illiarch@uiuc.edu User visits or uses materials remotely!
Top Content:Homepage July 4 Weekends 6.3%
“Archon” (Holdings Database) Area Lesson: the Holdings database is the heart of our web presence
Question Three: What do users search for? • Can measure both external and internal searches • Drill down to see ‘clickstream’ and exit pages
Goals Overview Lesson: Most users view our collection information at some point
Goal 1: Views Record Series Description Re-running searches to analyze how users get to and leave the site
“Clara Hamilton” YIKES!!!
Wow! Deadend!
17 (!) in Google Result Set Lesson We MUST provide links to digital content (where it exists) or create it (where it does not exist and users are trying to find it).
Lessons Importance of controlled subjects area <title> element usage Optimize ‘landing page’ It’s the digital content, stupid Clicked!
Conclusion 1: Beware Making Assumptions about Online Use • That users enter our main page, then search • That users see our homepage and use instructional/policy materials linked from it • That users want to walk a prescribed path to the physical records (DON’T assume visitor intent, Peterson, p. 25) • That digital content is a ‘value added’ function (in reality it is essential)
Conclusion 2: Google ranksdigital content ‘higher’ Images Full Description
Conclusion 3: Tailor Site Improvements to Revised Goals • Add more contextual information to landing pages (e.g. subject) • Identify materials for digitization (keyword analysis) • Improve Google page rank by integrating better information into title (66 character rule) • Improve user experience by being concise and putting most important information first
Conclusion 4: Emphasize content, not description • GA provides metrics that can drive decision making • Use keyword analysis to identify content for digitization
Improving the User’s Experience through Web Analytics*SAA Research ForumChicago, Illinois August 28, 2007 Christopher J. Prom Assistant University Archivist University of Illinois at Urbana-Champaign prom@uiuc.edu *Special thanks to Beth Yakel, Aprille McKay, and Helen Tibbo!