Download
1 / 3
30 likes | 168 Vues
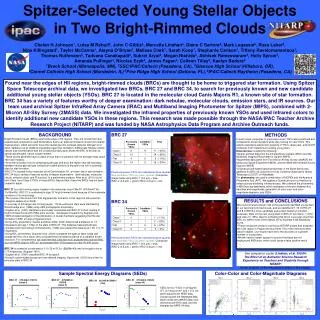
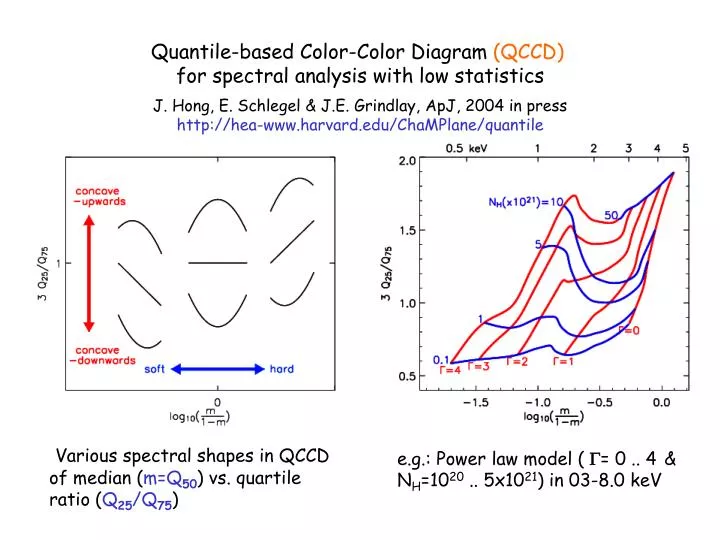
Quantile-based Color-Color Diagram (QCCD) for spectral analysis with low statistics. J. Hong, E. Schlegel & J.E. Grindlay, ApJ, 2004 in press http://hea-www.harvard.edu/ChaMPlane/quantile. V arious spectral shapes in QCCD of median ( m=Q 50 ) vs. quartile ratio ( Q 25 /Q 75 ).

E N D
Quantile-based Color-Color Diagram (QCCD) for spectral analysis with low statistics J. Hong, E. Schlegel & J.E. Grindlay, ApJ, 2004 in press http://hea-www.harvard.edu/ChaMPlane/quantile Various spectral shapes in QCCD of median (m=Q50) vs. quartile ratio (Q25/Q75) e.g.: Power law model ( = 0 .. 4& NH=1020 .. 5x10²¹) in 03-8.0 keV
QCCD is uniformly more sensitive than conventional CCD. e.g. simulations with 50 count source (25 bkg count) Conventional CCD of hard color vs. soft color (S:0.3-0.9, M:0.9-2.5, H:2.5-8.0 keV) QCCD (0.3-8.0 keV)
Median is a better substitute for hardness ratio (e.g. median or hardness ratio dist. for three example power law spectra =2, NH=1020, 5x10²¹, 5x1022 cm-2) Median vs. count (rate) 0.3-8.0 keV Hardness Ratio vs. count (rate) 0.3-2.0-8.0 keV