Download
1 / 36
360 likes | 473 Vues
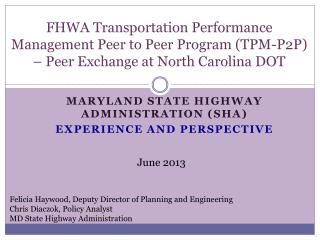
America’s first peer-to-peer safety program for young drivers. t-driver.com. Beginner Driver Problem. Fatality Rate per 100 Million Vehicle Miles Traveled. 8. 16-year olds are far more likely to be involved in a fatal crash. 6. Fatality Rate. 4. 2. 0. 19. 20-24. 25-59. 16. 17.

E N D
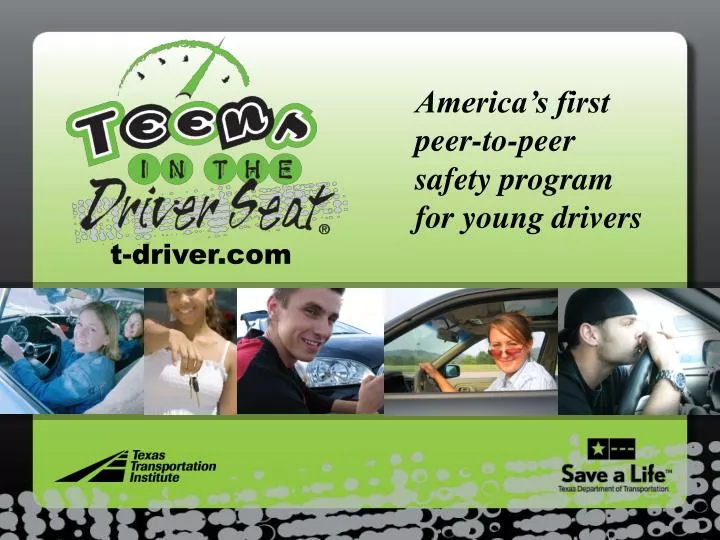
America’s first peer-to-peer safety program for young drivers t-driver.com
Beginner Driver Problem Fatality Rate per 100 Million Vehicle Miles Traveled 8 16-year olds are far more likely to be involved in a fatal crash 6 Fatality Rate 4 2 0 19 20-24 25-59 16 17 18 Driver Age (Years) (Source: National Highway Traffic Safety Administration, 2005)
Too many teens are dying • Motor vehicle crashes are the#1 killer of teens in America • Car crashes account for 2% of all deaths in U.S. • They account for 4 out of 10 teen deaths in the U.S. (Source: NHTSA, 2007)
The tragic toll • About 5,000teens per year killed in traffic crashes in U.S. • 400 per year in Texas (Source: Fatality Analysis Reporting System (FARS), 2007)
Picture this Like a commercial airliner full of teens crashing every week, for an entire year
Common misconception • Drinking and driving involved in only 14% of 16-year old driver crashes • Campaigns directed at this issue are missing 86% of the problem for this age group (Source: NHTSA)
The highest risks Driver inexperience Coupled with following situations/conditions • ● Driving at night/tired Distractions • ● Teen passengers • ● Cell phones/texting • ● Speeding/racing • ● Low seat belt use • ● Alcohol/drugs (Source: National Safety Council, 2007)
The teenage brain • Prefrontal cortex is last to develop • Helps with reasoning and decision making • Not fully developed until early 20s
Driving at night • 60% of teen crashes occur between 6 p.m. and 6 a.m. • Driving visibility is significantly reduced at night • Teens need more sleep - National Sleep Foundation recommends 9.25 hours • Average teen in U.S. is getting 6.9 hours • Fatigue has the same affect as being legally drunk (Source: National Sleep Foundation, 2006 Study)
Drowsy driving • More than half of all fatigue related crashes involve young drivers • 30% of teens report falling asleep in class at least once per week • More than half of teens surveyed admit they have driven drowsy (Source: National Sleep Foundation, 2006 Study)
Deadly distractions • More teen fatal crashes occur when passengers (often other teens) are in the car. (Source: NHTSA, Teen Unsafe Driving Behavior: Focus Group Final Report, 2006) • 2 out of 3 teens that died as passengers were in vehicles driven by other teens. (Source: NHTSA, Teen Unsafe Driving Behavior: Focus Group Final Report, 2006) • Car crashes are the leading cause of death for teens and tweens. (Source: CHOP, March 2008)
Cell phone use & texting • Drivers talking on a cell are 4 times more likely to be in a crash(Source: New England Journal of Medicine) • Teens engage in complex, non-driving tasks more frequently than adults (Source: VTTI 2009) • Texting is the new DWI -“intexticated” • Drivers who text are 23 times more likely to be involved in a crash (Source: Cohen & Graham, 2003)
Safety belt use • Teens wear their safety belts less than other drivers (Source: NHTSA, Teen Unsafe Driving Behavior: Focus Group Final Report, 2006) • Teens belt use in the back seat is about 40% • More than half of teen drivers and passengers killed aren’t buckled up at the time of the crash (Source: NHTSA.gov, Youth Traffic Safety Statistics, 2008)
Speeding • A large percentage of teen crashes involve speeding (Source: NHTSA, Teen Unsafe Driving Behavior:Focus Group Final Report, 2006) • About 50% of teen driver and passenger deaths occur in speed related crashes (Source: NHTSA, Traffic Safety Facts, Graduated Driver Licensing System, January 2008)
New Texas laws you should know….. • Night driving, passengers now restricted for 1 year • Talking/texting on cell prohibited for all under 18 • No cell use in school zones, regardless of age • All drivers, passengers must buckle up – front or back • Driving test required at end of driver ed. course • DWI with child passenger – might lose license
TDS as part of the solution • Peer-to-peer program • Increase awareness of teen driving risks • Decrease the number of crashes for teen drivers
Involving Teens is Critical “Tell me something, and I’ll forget. Show me something, and I may remember it. Involve me, and I’ll understand.” -- Chinese Proverb
4 steps to saving lives • Identify TDS team members • Find out what teens in your community know • Share what they need to know • Keep the program going
Pampa 300+ high schools and 300,000+ teens reached to date Lubbock Wichita Falls Dallas Ft Worth Odessa El Paso Waco Tyler Bronte College Station Austin Beaumont Brenaham San Antonio Yoakum Houston Bracketville Taft Laredo Corpus Christi La Joya Mc Allen
Areas interested in TDS In addition:Qatar
TDS web site • Testimonials • Short Stories • Videos • Posters • Project ideas • Order Forms • Hot topics • Contests • Blog/comments section
Web site: t-driver.com T-shirts and jerseys TV messages and radio spots TDS logo, artwork Downloadable posters How-to guide Promotional items TDS tools
Find out what teens know • Tool is provided to assess awareness and driving behavior • TTI provides data summary • Useful for: • Identifying students lacking awareness on dangers and risky driving behavior • Changes in awareness and behavior (post-assessment)
TDS banners Official banner or make your own • Use the banner at… • Sporting Events • Concession Stands • Cafeteria • Library
Need more? • Positive media coverage for your school • Contests with prizes • Awards for completing the program • Teen Advisory Board • TDS Annual Meeting • TDSer of the week • SponStar Award
Teenage Knowledge of Highest RisksTDS Pilot Project – San Antonio, 2002-2003 Awareness Before Awareness After Source: Pre- and post-surveys at TDS pilot program school, n = 2,570
How we compare to other states & U.S. • Change in teen drivers involved in fatal crashes for states with a “Fair” GDL rating, 2002 to 2007: • U.S. = - 14.1 % • Florida = + 12.2 % • Texas = - 33.0 %
Teen Traffic Fatality Trends and Benchmarks in Texas 1995 On- Road Driving Test Removed Parent Taught Driver Ed Implemented GDL Implemented TDS Implemented
Percent improvement in Texas Teen Drivers Involved in Fatal Crashes by Age, 2002-2007
Field studies • Wireless device use by drivers: down 30% • Seat belt use: up14%
City of Garland Data Twelve Fatalities from 2002 -2006 (with No active TDS programs) One Fatality from 2006 to present (with active TDS programs)
Program Contacts ProgramDirectorPublic Affairs Russell Henk Bernie Fette (210) 979-9411 (979) 845-2623 r-henk@tamu.edub-fette@tamu.edu Sponsors State Farm of Texas