Download
1 / 49
540 likes | 913 Vues
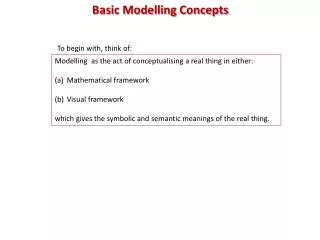
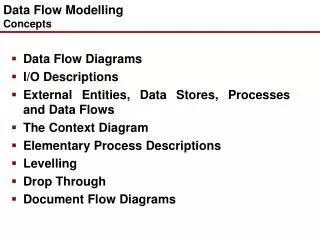
Data Flow Modelling Concepts. Data Flow Diagrams External Entities, Data Stores, Processes and Data Flows Elementary Process Descriptions Levelling Document Flow Diagrams. Key Definitions. A process model is a formal way of representing how a business operates

E N D
Data Flow ModellingConcepts • Data Flow Diagrams • External Entities, Data Stores, Processes and Data Flows • Elementary Process Descriptions • Levelling • Document Flow Diagrams
Key Definitions • A process model is a formal way of representing how a business operates • Data flow diagramming shows business processes and the data that flows between them
Key Definitions • Logical process models describe processes without suggesting how they are conducted • Physical models include information about how the processes are implemented
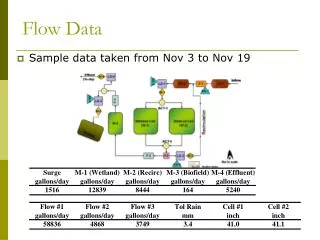
Data Flow Diagrams aid communication e Manager Purchase Order 1 Stock Clerk Stock List Stock M2 Order Stock List P.O. File Stock d Supplier Purchase Order Delivery 2 Stock Clerk Purchase Order Receive Orders M1 Cabinet Stock * Matched Orders e Manager Delivered Goods 3 Cashier Stock Sell Sold Goods M2 File Stock * Bought Goods a Customer External Entities Processes Data Stores
Data Flow DiagramsDFD Notation • The DFD is a diagram that consists principally of four symbols, namely the external entity, the dataflow, the process and the datastore • Additionally, a physical flow can be shown on the DFD of the current system
Data Flow DiagramsExternal Entities d Supplier
Data Flow DiagramsData Flows Customer Details Goods Cosmetics • Data Flow (usual) • Bi-directional Flow (rare) • Flow Between External Entities (for convenience) • Resource Flow (for convenience)
Data Flow DiagramsProcess Sell Stock 3 Cashier
Data Flow DiagramsData Stores D3 Suppliers Stock M1 File T1 Unpaid Invoices D1 Orders D1 Orders • Digitised • Manual • Transient • Duplicate
Data Flow Diagrams Decomposing Data Flow Diagrams • Any process on a DFD may be broken up into several sub-processes which, when viewed collectively, make up that process • Thus for example we may break-up process 1 of the Small Stock System into that shown on the next slide:
e Manager 1 Order Stock Stock List Purchase Order 1.1 1.2 Produce Record Stock Purchase List Order Stock List Purchase Order Purchase Order Stock M2 M1 Cabinet File Data Flow Diagrams Decomposing Data Flow Diagrams * *
Data Flow Diagrams Decomposing Data Flow Diagrams • The decomposition of a DFD into lower level DFDs is known as levelling • The DFD that shows the entire system is known as the ‘top level’ or ‘level 1’ DFD • The DFDs that contain more detailed views of the level 1 processes make up ‘level 2’ DFDs • Any level 2 process that is further decomposed gives rise to a level 3 DFD and so on
Data Flow Diagrams Decomposing Data Flow Diagrams Elementary Process Description System: SmallStock DFD Type: Current Process Name: Record Purchase Order Process Id: 1.2 Managers give the stock clerk a ready-made purchase order. The stock clerk places this order in the Purchase Order Cabinet. It is the managers’ responsibility to send the order directly to the supplier they have chosen. Each purchase order contains product information taken from the supplier’s price list. The date after which a delivery of goods will be unacceptable is also included.
1.2 Record Purchase Order Data Flow Diagrams Decomposing Data Flow Diagrams *
Data Flow Diagrams Context Diagrams
Data Flow Diagrams Starting from the Context Diagram • To develop a Context Diagram we carry out the following tasks: (i) Identify all sources and recipients of data from the system, i.e. external entities (ii) Identify the major data flows to and from the external entities (iii)Convert each source or recipient into an external entity symbol (iv)Add the data flows between each external entity and a single box representing the entire system
Data Flow Diagrams Starting from the Context Diagram Supplier s Delivery Note r Purchase Order s Delivery Details s Invoice Purchaser s P.O. Quantities r Stock Report Customer r Dispatch Note Sales & Marketing s Customer Order r Matched C.O. #1 Accounts r Matched Invoices External Entity S or R Data Flow
Data Flow Diagrams Starting from the Context Diagram a Supplier Payment Delivery Note Purchase Order Delivery Invoice Details e d Matched Invoice Despatch Note Accounts Customer Stock Report Matched C.O. Customer Order Copy #1 P.O.Quantities Customer Order b c Sales and Purchaser Marketing ZigZag Warehouse System
Document Flow Diagrams • Identify all recipients and sources of documents, whether inside or outside the system boundary • Identify the documents that connect them • Convert each source and recipient into an external entity symbol • Add data flow arrows to represent each connecting document • Add the system boundary to exclude the external entities identified in the context diagram
Document Flow Diagrams Supplier Invoice P.O.Clerk Supplier Delivery Times Stock Clerk Stock Clerk Stock Report Purchaser Stock Clerk Stock Report Despatch Supervisor Despatch Clerk Despatch Note Customer Customer Customer Order Sales & Marketing Sales & Marketing Customer Order Despatch Clerk Despatch Clerk Despatch Report Despatch Supervisor Despatch Super. Matched Dsp Rep Despatch Clerk Despatch Clerk Matched CO #1 Sales & Marketing …. Source Document Recipient
Document Flow Diagrams Despatch Supervisor Sales and Matched Marketing Despatch Rpt Customer Order Despatch Report Matched C.O. Copy #1 Despatch Clerk
Data Flow DiagramsConverting Document Flow Diagrams What process generates this document flow? What process receives this document flow? Is the document stored by a process? Where is the document stored? Is the document created from stored data? What business activity triggers the process? Is the document a source of new data? To transform the Document Flow Diagram into a DFD we follow each document flow in turn, asking the following questions:
e P.O. Manager Stock List Purchase Order Matched Orders d Small Stock Delivery Supplier System Bought Goods a Customer Data Flow Diagrams Context Diagrams • A level higher than level 1, showing the whole system as a single process with external entities around it, is also possible:
Data Flow Diagrams Decomposing Data Flow Diagrams
Data Flow Diagrams Starting from the Context Diagram • We can now follow each flow into and identify the elementary process responsible for it • A grouping of these elementary processes can then give us a first glimpse of the system’s Data Flow Model
Data Flow DiagramsConverting Business Activity Models Check Delivery 2 Goods Receiving b Check Supplier Delivery Place Goods Delivery Note in Delivery Dock P.O. Copy Matched P.O. Purchase Orders M1 Allocate Stock T2 Matched P.O.’s Location Matched P.O. Remove Goods from Delivery Dock New Stock M2 Stock 3 Stock Keeping Store Stock Store Goods in Depot
2 Goods Receiving 2 Goods Receiving 2 Goods Receiving b b Check Check Check Supplier Supplier Delivery Delivery Delivery Delivery Note Delivery Note Matched P.O. Matched P.O. T2 T2 Matched P.O.’s Matched P.O.’s Data Flow DiagramsTips • For a process to be complete, it needs to have both an input and an output (shown by data flows going into and coming out of it)
f f Someone Someone 2 Something Do something with it Same something Something M2 M2 A data store A data store Data Flow DiagramsTips WHY?
Elements of a Use Case • Trigger -- event that causes the scenario to begin • External trigger • Temporal trigger • All possible inputs and outputs • Individual steps • Show sequential order • Show conditional steps
Steps in Building DFDs • Build the context diagram • Create DFD fragments for each scenario • Organize DFD fragments into level 0 • Decompose level 0 DFDs as needed • Validate DFDs with user
DFD – Common Errors Error Error Error
Level 0 Tips • Generally move from top to bottom, left to right • Minimize crossed lines • Iterate as needed • The DFD is often drawn many times before it is finished, even with very experienced systems analysts
Tips for Level 1 and Below • Sources for inputs and outputs listed at higher level • List source and destination of data flows to processes and stores within each DFD • Depth of DFD depends on overall system complexity • Two processes generally don’t need lower level • More than seven processes become overly complex and difficult to read
Validating the DFD • Syntax errors • Assure correct DFD structure • Semantics errors • Assure accuracy of DFD relative to actual/desired business processes • User walkthroughs • Role-play processes • Examine lowest level DFDs • Examine names carefully
How should we gather requirements? Use cases? 1. Use cases hold functional requirements in an easy-to-read text format 2. They make a good framework for non-functional requirements & project details. 3. Use cases show only the Functional req’ts. 4. Design is not done only in use case units.
Use cases do not collect formulae, state, cardinality, performance, uptime, ... • Examples: 1. Order cost = order item costs * 1.06 tax 2. Promotions may not run longer than 6 months. 3. Customers only become Preferred after ... 4. A customer has one and only one sales contact. 5. Response time is ... 6. Uptime requirement is ... 7. Number of simultaneous users will be ...
Use the scenarios directly to Design and Test the system. What if...? Scenarios “Knows how to...” “Knows how to...” “Knows how to...”
Summary • The Data Flow Diagram (DFD) is an essential tool for creating formal descriptions of business processes and data flows. • Use cases record the input, transformation, and output of business processes. • Eliciting scenario descriptions and modeling business processes are critically important skills for the systems analyst to master.