Download
1 / 46
460 likes | 461 Vues
The Evolving Quality of Telephonic Speech. Why VoIP's speech quality is disappointing, and how it wouldn't have to be. Richard A. Thompson Emeritus Professor Telecom Program University of Pittsburgh rthompso@pitt.edu. Outline. Introduction Human capacity for aural quality

E N D
The Evolving Quality of Telephonic Speech Why VoIP's speech qualityis disappointing, and howit wouldn't have to be. Richard A. Thompson Emeritus Professor Telecom Program University of Pittsburgh rthompso@pitt.edu
Outline • Introduction • Human capacity for aural quality • History of evolving & devolving quality • Network integration vs app quality • High-fidelity Voice-over-IP
1. Introduction • Telecom technology has benefited the human species. • Morse, Bell, Tesla, Zworykin we communicate over distance, • But their inventions had greatly reduced aural & visual quality. • During the last century, successive technology … • Raised many aspects of the original audio & video quality, • But, also lowered other aspects of app quality • Two examples of lowered quality: • Successive technologies reduced audio bandwidth • pixel-block “dance” after noisy or lost internet packets. • This talk discusses the devolution of audio quality • And concludes that we don’t have to live with it.
Gucci Family Slogan “Quality is remembered … long after the price is forgotten” $895 $1950
2. Human Capacity for Aural Quality • Anatomy, physics, physiology, & brainware • of human speech and hearing • How we discriminate phonemes & recognize speakers • Section Outline • Review of Human Speech • Review of Human Hearing • Review of Aural Processing
2. Human Capacity for Aural Quality Review of Human Speech • Speech = complex acoustic signal humans emit & receive • Sequence of air compressions & rarefactions; • Travels about 770 mph • Speaking requires a complex structure: • By modulating an exhaled air stream, we emit sequences of elementary sounds, called phonemes. • If we partly close our larynx as we exhale, • our “vocal cords” vibrate at a fundamental pitch, f1 = 80 to 350 Hz, • depending on the speaker’s size, shape, gender, & age. • Altering tension changes f1 to any value between half and double its regular pitch; • for singing and linguistic cues.
Variable Acoustic Filter • Acoustic waveform at the larynx resembles a saw-tooth • rich in harmonics. • Mouth is a variable resonant cavity; • It acts as a tunable acoustic filter. • By changing our mouth’s internal shape, • we attenuate different harmonics as they pass through. • Our two main techniques are: • Change our tongue position, • Switch our nasal cavity in/out using our uvula. • Each phoneme has a different “recipe” • of the weights of the harmonics. ee nn ee aa
Taxonomy ofEnglish phonemes Typeunvoicedvoiced Vowel-like mouth - vowels, ll, rr nose - mm, nn, ng diphthongs - ow, long-i, … Fricativeshhwh (sustained sszz turbulence) shzh ff vv Plosivesch j (burst k g turbulence) p b t d • Sustained phonemes: • vowels, ll, rr, • nasals, • fricatives. • Dynamic phonemes: • Slowly: diphthongs • Quickly: plosives • Last eight rows: • 8 diff. mouth positions • 2 phonemes per position; • By vibrating larynx or not.
Mouth-to-Ear Spectrum • Runs from f1to our hearing limitof 14 - 20 kHz, • depending on the listener’s age, etc. • Acoustic energy in different phonemes • is distributed differently over the aural spectrum. • For example, fricatives like ss, • have significant energy at the high end of the spectrum. • Hearing accuracy is • a non-linear function of how much of this spectrum is actually heard.
2. Human Capacity for Aural Quality Review of Human Hearing • Ear drum, in each ear, • is AC-coupled(the Eustachian tube maintains DC) • to the cochlea by tiny linked bones. • Cochleais a horn, wrapped into a snail-shell, • filled with fluid, lined with small hairs. • The acoustic signal • causes standing waves inside the cochlea to excite nerves at the base of each hair. • These nerves transmit a parallel signal to the brain, giving the weights of the signal’s harmonics. • Cochlea & its driver (in brainware) compute* the • Fourier Series coefficients of the received acoustic signal. *Color code for what we think happens
AD Hearing Brain-Ware PD Ear HW ED NF SI • Behind this driver, mid-level BW does more processing: 1. Calculates acoustic directionality, 2. Selects the desired signal out of background noise, 3. Performs phoneme discrimination (independent of the speaker), 4. Identifies who the speaker is (independent of the phoneme). • Last 3 tasks are supported by • high-level syntactic & semantic processing which, • at even higher levels of brainware, • depend on content, context, background, and emotional state. • This paper deals only with low- and mid-level brainware, • Which performs the last two tasks on the list above.
2. Human Capacity for Aural Quality Review of Aural Processing • Mid-level brainware identifies speakers • by comparing the set of weights, received from the driver, • against a speaker database. • Our accuracy at finding a best match is a • nonlinear function of how many weights the speaker-identifier process receives from the driver. • This number of coefficients depends on how much acoustic spectrum is heard by the cochlea & its driver. • We discriminate phonemes more indirectly. • The spectral envelope of most phonemes has four relative maxima, called “formant frequencies,” F1 to F4.
Formant Frequencies • F1 and F2 peaks for eeand aacan be seen • in the frequency domain. • Generalized time-domain diagrams: • of F1and F2for 21 phoneme-pairs, • each a dynamic consonant that elides into a vowel. f1 F1 F2 ee aa
Formants for Vowels • Spectral position of these formants, especially F1and F2, • is the most important cue in phoneme discrimination. • But, it’s complex because formant positions are speaker dependent. • Each point is an [F1, F2] value for • 76 speakers of 10 sustained phonemes. • Clusters show the intended phoneme. • Proximities pot. error w/o ++spectrum. • EG, upper-left cluster ee. • Low F1& high F2consistent spectrum. • High prob. eeinterpreted as short-i. ee
Phoneme Discrimination • We discriminate phonemes in mid-level brainware by: • Computing formants from weights received from driver, • Comparing Fs against a database that works like • Our accuracy at finding the best match is a • nonlinear function of how many formants the phoneme-discriminator has available. • This # of formants depends on how much of the acoustic spectrum is heard by cochlea & driver. • We have a mirrored setof multilevel processes • in the speaker’s brainware also. • These communicating processes translate thoughts into language, • then to sequence of neural signals that control our mouth parts.
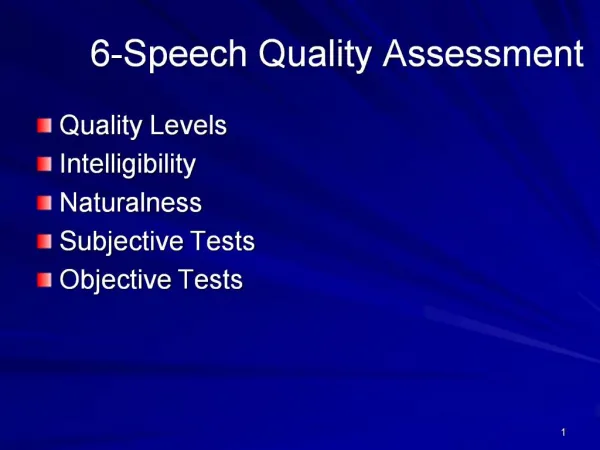
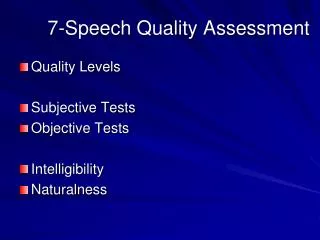
3. Technology’s Impacton Quality • After listing components of aural quality, • we review successive technologies and how they • raised some aspects of audio quality and lowered others. • After discussing their effect on • speaker identification and phoneme discrimination, • We review the history of the complaint that technology • should never lower any aspect of application quality. • Section Outline • Aural Quality and its Impairments • Identifying Phonemes and Speakers • The History of the Complaint
3. Technology’s Impact on Quality Aural Quality & its Impairments • Qualityof a natural acoustic signal is measured by its: • Intensity (loudness), • Purity (nothing else added), • Immediacy (un-delayed) • Clarity (undistorted), & • Fidelity (). • By definition, Fidelity measures an audio signal’s • faithfulness to its acoustic analog. • We’ll defer to the lay def that it implies high band-width.
Natural Impairments • Natural acoustic signals suffer 5 impairments: • loss, • noise, • crosstalk, • delay, & • echo. This figure will grow downward on the following slides
Pros & Cons ofAnalog Networks • The role of any network is to eliminate natural loss. • Usually replaces large acoustic delay by small signal delay • May also reduce crosstalk & echo. • Analog networks add crosstalkfrom the loop pair • and echo from impedance mismatch and leaky hybrids. • &, they add new impairments, not seen in natural signals: • Amplitude distortionfrom amplifiers that clip, • Band-restriction& frequency distortionfrom wire reactance, • Delay distortionbecause frequency components have diff velocities.
Fidelity inAnalog Networks • 500-sets • Cut f1 off at low end • Had12-kHz of bandpass. • (modern phones have no reason to provide that much BW) • If phones are connected in a local call, • loop limits end-to-end bandpass to 8-10 kHz, dep on loop-length. • In long-distance calls, • network further limits bandpass to 4-6 kHz, dep on distance. • 4-kHz analog LD channel had poorestfidelity, but… • Bell System “spun” the term “toll grade” to imply high quality. • Note: upper limit of all BWs is given as “3-dB frequency;” • There is significant audio power outside these formal limits.
Subsequent Analog improvements • Analog technology advancements in: • Channels (fiber), • Amplifiers, • Echo cancellers, • Shielding, & • Noise filters; • But, notband-restriction, • nor the other two forms of distortion. • Biggest improvement comes from going digital Improved: • loss, • noise, • crosstalk, • delay, • echo, & • amplitude distortion.
Pros & Cons of Digital Networks • Digitizing an audio signal greatly improves intensity. • And, a digital PSTN is virtually noise-free. • Even loop noise (assume ADC in CO) is partially blocked on speaker side by ADC anti-alias filter. • But, newnoiseis added by: • quantizing, companding, mu-to-A conversion, & bit errors. • And, Echo is worse because digital transport is 4-wire, • which requires many more hybrids (which can leak) in the network. Note that a digital network is embedded inside an analog network
Fidelity in Digital Networks • By far, the worst impairment is that • anti-aliasing filters in the A-to-D converters impair fidelity, • So, allcalls are nominally as band-limited as LD analog calls • Fidelityis evenperceptibly lower than “nominal” • because blocking all audio above 4 kHz • requires a half-power point at 3.7 kHz & • high-end drop-off that is much steeper than in analog networks. • So, digital calls have better SNR than analog calls; • But a local digital call has perceptibly lower fidelity than even a long-distance analog call. • For example, analog digital 0 4 kHz
VoIP’s Cons • VoIPfurther impairs digital audio quality • Audio purityis further impaired because: • speech compression exaggerated bit errors • noticeable clunks from lost packets (packet loss: 0 1% 5% ) • silence-detecting codecs’ slow-start may clip leading-plosive Note that a packet network is embedded inside a digital network
VoIP & Delay • Immediacyis greatly impaired by delays caused by: • Packetization, jitter buffers, router proc, & multi-hop packet re-xm. • VoIP calls often exceed • user acceptance of conversation interaction delay. • User opinions below are my “compromise” • between Bell System standards & IETF standards Round-Trip DelayOpinion < 150 ms good 150-300 ms noticeable 300-450 ms annoying > 450 ms unacceptable
VoIP & Echo • Acoustic echo • Is eliminated by wearing a head-set. • Electrical echo • VoIP-PSTN gateways more problematic than D-to-A gateways because echo canceller is far from the echo source (hybrid) • User sensitivity to echo depends on individual, echo-to-signal ratio (TELR), & one-way delay. • Since a digital conversation’s TELR 55 dB, • One-Way delay must be < 200-500 ms; but it’s often >200ms. • Large delay reduces the effectiveness of electronic echo cancellers. • Summarizing, VoIP-to-POTS &, esp, VoIP-to-cell calls • are often characterized by annoying echo. is much worse because:
Summarizing… • Digitizing speech • Improves intensity & purity; • But, noticeably degrades fidelity. • Overall, digital is perceived as “better than” analog; • But, it could be much better. • VoIP makes no positive contribution; • VoIP only lowers the quality. • The last section proposes how we might change this.
3. Technology’s Impact on Quality Identifying Phonemes and Speakers • “Telephone voice” impairs our ability to • hear what a speaker says & identify who the speaker is. • 4-kHz DS0 channel has enough BW for F1& F2, Little difficulty identifying vowels, ll, and rr. • Hearing the 3rd and 4th formants would: • Slightly improve discrimination of these sounds, • Greatly improve discrimination of fricatives & plosives. • A lowF3 passes over a DS0 channel; • But a highF3 will not, and F4 will not.
++Bandwidth ++Phoneme Discrimination • We need a 7-kHz channel to receive all four formants, • & >7 kHz for sounds we typically struggle with: • nasals (distinguishing mm and nn), • plosives (distinguishing k and t), • fricatives (distinguishing ss and ff). • Exp: ff was spoken to many listeners over 3 channels: Identified as: Chan BWffthpother 200-5000 Hz 194 35 6 9 200-2500 Hz 186 31 6 13 1000-5000 Hz 162 28 12 50
++Bandwidth ++Speaker Identification • We identify speakers directly by their Fourier weights, • Not their formant frequencies. • Success is based on the amount of data: # weights received. • Consider three population groups: • Consistent with most people’s experience on the phone: • Men are easily recognized, women less easily, • & we see why “all children sound the same on the phone.” • A child could be recognized over a 12-kHz channel • as well as an average male is over a 4-kHz channel. • At 12kHz, any woman would be as identifiable as any man at 4kHz, • and men could be almost perfectly identified. Typef1-range#H’s < 3.7kHzRank Men 75-150 Hz25-50 most Women 140-300 Hz12-26 middle Children 275-350 Hz10-13 least Section 4 discusses how audio quality is Impacted by “integrated networks”
The History of the Complaint • When T1 was proposed in the 1960s, • Amos Joel objected to its 8-kHz sample rate. • T1’s advocates stifled him by saying he was • a dinosaur who objected to digital voice (he did not). • Now, some VoIP advocates • use this tactic to stifle their critics. • 8-kHz sampling was standardized • when bandwidth was expensive; • Now that it isn’t, • we’re still stuck with the DS0 channel … • or are we?
4. Network Integrationand App-Quality • Review historical attempts at integrating networks, • Generalize how integration naturally lowers app quality • Ask why we have refused to learn this lesson. • Section Outline • History of Integrated Networks • Why Integration Lowers App Quality • Why are we Blind to this Lesson?
4. Network Integration and App-Quality History ofIntegrated Networks • More than 35 years ago, ISDN … • was proposed as a global end-to-end network for all data types. • Today, it’s relegated to the network edge, as an access standard. • ISDN’s post mortem shows two reasons it failed: • ISDN needed a global digital network, • an inexpensive users’ appliance/terminal, • and a collection of integrated services – simultaneously. • AT&T could have done it, but focused on surviving (it didn’t). • We learned that the application matters. • Ethernet’s stat-muxing was more efficient for bursty data, • especially key-strokes on a LAN, than ISDN circuit switching. • And, efficiency trumped integration.
The 2nd attempt • More than 20 years ago, ATM … • was proposed as a global end-to-end network for all data types. • Cell relay & virtual circuits avoid congestion from large packets • Limited success in “core,” where congestion is significant, • Failed to achieve its main goal, again for two reasons: • ATM’s success required that it also be cost-effective as a LAN. • But, Ethernet prevailed because of embedded base of interface cards, LAN-manager familiarity, & evolution to higher rates • We saw again that application matters. • ATM was compared to a duck: “Ducks can swim, fly, and walk, but none well. ATM carries voice, data, and video, but none well.”
The 3rd attempt • Now, the Internet is proposed • as a global end-to-end network • to carry all data types. • ISDN and ATM each failed • in part because application matters. • What is different now?
4. Network Integration and App-Quality Why IntegrationLowers App Quality • Let’s examine an economic explanation. • Box represents the cost of a basic un-optimized network • Consider four cases defined by Networks: Separated Integrated Low app-quality High app-quality $ basic network 1 2 3 4
Implementations withLow Quality $ basic voice network • Separated & low - 2 apps, voice & data, with equal load • Boxes represent the cost of two separate networks, • each dedicated to one app. • App quality is barely acceptable because • neither network has been optimized for its app’s quality. • Integrated & low - 2 apps over an un-optimized integrated network. • This box’s area >> the reference square • because the integrated network supports twice as much load. • But, its area is less than the sum of the areas of 2 squares • because of economy-of-scale & reduced staff of network managers. • Since apps may interact in the integrated network, • each app’s quality is worse than in 2 separate networks. • This is the classic “duck”. $ basic data network $ basic integrated network
Implementations withHigh Quality 3. Separated & high – Increase the quality of both apps by optimizing each network in Case 1 raises cost of each. • Squares rectangleson different dimensions optimize each network differently for resp. app. • Integrated & high - Improve apps’ quality in integrated network • Perform same optimizations as on the separate networks. • So, the “duck” is elongated, but in both dimensions. • Significantly larger square than in Case 2 • “SWAN” (Superior-service-With-All-apps Network). $ integrated network that is good for voice & data $ good data network $ good voice network
$ basic voice network $ basic data network Integration vs App-Quality $ basic integrated network • If we don’t care about app-quality, • Case 2 beats Case 1 • the integrated network is slightly more economical. • If we do care about quality, Case 3 vs Case 4? • Unclear how area of SWAN compares against • the sum of the areas of 2 separate rectangles • Does the cost of optimizing an integrated network, • so its apps have good quality, • cancel the small savings provided by the integration? • If not, wouldn’t IP-based voice carriers • Like Qwest long-distance, Skype, and Vonage • have dominated the telephone industry by now? $ good voice network $ good data network $ integrated network that is good for voice & data
Why are we Blindto this Lesson? • Prior analysis is admittedly weak, • But it’s not fundamentally flawed. • Seems clear from analysis & history lesson • that network integration is a bad idea; • assuming we don’t want to further degrade app-quality. • Alchemists, a half a millennium ago, • had a goal that is at least easy to appreciate. • Our determination to continue trying • to integrate networks is admirable, but puzzling.
5. What Can We Do? • Ranting about how bad things are • has become an all-too-familiar form of discourse. • Want to more than rant, & make a positive contribution, • This section makes the transition from • how-bad-it-is to how-good-it-could-be by discussing • the market potential and proposing a solution. • Section Outline • Market Potential for High-Quality Apps • High-fidelity Voice-over-IP
5. What Can We Do? Market Potential for High-Quality Apps • Significant market niche that cares about voice quality? • If there is a market, it’s among people who • appreciate music that sounds better over a high-fi channel & • are annoyed by, or have difficulty with, cell-phone audio quality • This group is older, and growing rapidly as • the surge of baby boomers become older … and deafer. • Decreasing ear-bandwidth reinforces adequacy of 12-kHz channel. • Not an accurate marketing study - But, it seems likely that, • If market size to justify products isn’t significant enough yet, • it could become large enough in just a few more years.
5. What Can We Do? Packe-tizer High-fidelityVoice-over-IP analog signal 12-kHz AAF A-to-D converter 24 KHz • VoIP presents the opportunity to raise voice quality, • not just to toll-grade, but even beyond. • 12-kHz channelwould virtually eliminate “telephone voice” & • Improve phoneme discrimination &speaker identification. • Channel bandwidth = 3x the DS0’s equivalent bandwidth • G.711 codec 3x: Anti-aliasing filter’s BW & the ADC’s sample rate • & Must packetize the digital stream at speaker-end • So it’s easily separated for a G.711 at the listener-end. ? Should be easily downward compatible: G.711New ? Made to work with speech compressing codecs • While this proposal needs to be built & tested, • Two others have been implemented and tested at Pitt Note: The paper is incorrect.
Minimizing Delay 2. VoIP delay, • & echo’s dependence on delay, • can be reduced by optimal packetization. • When a network is lightly loaded, • packetization delay is reduced by generating small packets • Often – perhaps every 10 ms. • When a network is heavily loaded, • network queue delays are reduced by generating large packets • less often – perhaps every 30 ms. • We have demonstrated this • & necessary signaling has been implemented in RTCP.
Maximizing Quality 3. Overall audio quality, • as defined by the ITU, is a complicated function of • codec type, end-to-end delay, fidelity, etc. • If an IP-phone has multiple codec-types, • We can optimize overall audio quality • by changing codec-type mid-stream, • depending on network congestion. • Control signaling can also use VoIP’s RTCP. • At Pitt, we are building … • a prototype system, we call Ernestine, • in which such techniques will be built & tested.
6. Conclusion • Technology has improved net audio quality • over the last 100 years. • But, some aspects of audio quality, especially fidelity, have devolved. • But, this devolution has an ironic solution. • VoIP’s poor audio quality is notinherent to VoIP; • But, is a function of design choices, • some of which date back to the 1960s. • Surprisingly, VoIP gives us the opportunity • to provide excellent audio quality, • If design changes proposed here are implemented.