Download
1 / 33
330 likes | 424 Vues
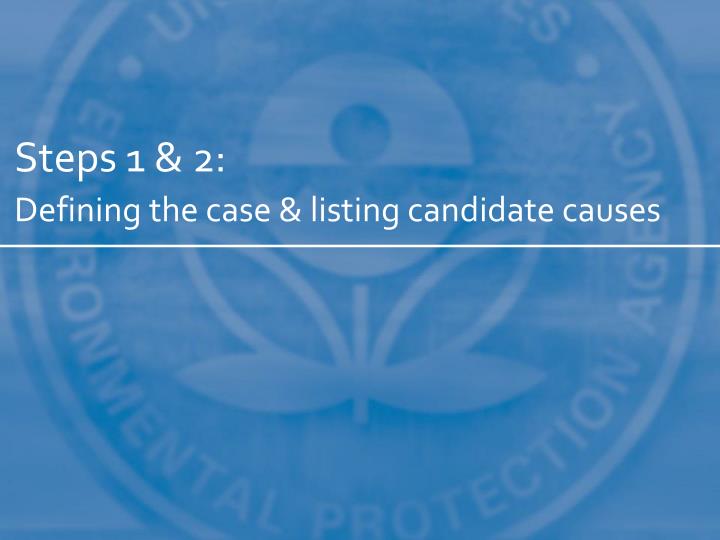
Steps 1 & 2: Defining the case & listing candidate causes. Fish kills Organismal anomalies Changes in community structure Low biotic index values Violation of biocriteria. Detect or suspect biological impairment. Stressor Identification. Define the Case. List Candidate Causes.

E N D
Steps 1 & 2: Defining the case & listing candidate causes
Fish kills • Organismal anomalies • Changes in community structure • Low biotic index values • Violation of biocriteria Detect or suspect biological impairment Stressor Identification Define the Case List Candidate Causes Decision-maker and Stakeholder Involvement As Necessary: Acquire Data and Iterate Process Evaluate Data from the Case Evaluate Data from Elsewhere Identify Probable Cause Identify and Apportion Sources Management Action: Eliminate or Control Sources, Monitor Results Biological Condition Restored or Protected
macroinvertebrate IBI = 64 PC1 NC1 Pretend Creek Nearby Creek Pretend Springs city limit NC2 macroinvertebrate IBI = 22 PC2 What triggered SI at Pretend Creek?
Detect or Suspect Biological Impairment • What biological effects are observed? • Where & when are they occurring? • Where are comparable reference sites? Stressor Identification Step 1: Define the Case List Candidate Causes Decision-maker and Stakeholder Involvement As Necessary: Acquire Data and Iterate Process Evaluate Data from the Case Evaluate Data from Elsewhere Identify Probable Cause Identify and Apportion Sources Management Action: Eliminate or Control Sources, Monitor Results Biological Condition Restored or Protected
Defining the biological impairment • Identify subset of biological measures to focus & guide SI process • Choose wisely, & where possible, aim for specificity
smallmouth bass VA WV northern hogsucker redhorse sucker smallmouth bass redbreast sunfish March–May 2006 Acute phase (mid-March) Chronic phase (March–May) May 25–31, 2006 Acute phase only Example: fish kills in Virginia & West Virginia WHAT? WHEN?
PC1 NC1 Pretend Creek Nearby Creek Pretend Springs city limit NC2 PC2 Defining the case for Pretend Creek EPT taxa richness (% of PC1) Site
18 EPT genera brook trout PC1 NC1 Pretend Creek Pretend Springs city limit Nearby Creek NC2 PC2 8 EPT genera no brook trout Defining the case for Pretend Creek
Detect or Suspect Biological Impairment Stressor Identification • Make a map • Gather information on potential sources, stressors, and exposures • Develop a conceptual model • Engage stakeholders • Develop “final” list Define the Case Step 2: List Candidate Causes Decision-maker and Stakeholder Involvement As Necessary: Acquire Data and Iterate Process Evaluate Data from the Case Evaluate Data from Elsewhere Identify Probable Cause Identify and Apportion Sources Management Action: Eliminate or Control Sources, Monitor Results Biological Condition Restored or Protected
Include pollution sources & other environmental conditions or factors that affect which candidate causes are listed forest forest dairy farm PC1 subdivision NC1 Pretend Springs city limit forest NC2 unimpaired site impaired site PC2 WWTP industrial facility dam
Listing candidate causes • Hypothesized causes of impairment • Sufficiently credible to be analyzed • Focus on proximate stressor, or stressor directly inducing effect of concern • May include sources, mechanisms of action, or several causes acting together (causal scenarios) • Develop list using: • Data from site • Info on known or potential sources • Existing knowledge from site, region & elsewhere • Stakeholder input
Combining stressors • Strategies • Combine if they share causal pathways, modes of action, sources & routes of exposure, or if they interact • Re-aggregate stressors that have been unnecessarily disaggregated • Identify independently acting stressors that cause the same effect • Define effects more specifically • Warnings • Avoid combining causes without an underlying model • Avoid broad candidate cause definitions • Don’t lose independent effects of individual causes
MR3 MR1 POTW Example: Willimantic River, CT 1. Toxicity from metals, ammonia, or complex mixture 2. Removal of organisms during high flows 3.Loss of interstitial habitatdue to settled particles 4. Asphyxiation due to low dissolved oxygen 5. Mortality due to thermal stress 6. Taxa loss due to altered food resources
Example: fish kills in Virginia & West Virginia 1. Low dissolved oxygen in water 2. Gill damage from ammonia, high pH, or other mechanism prevents uptake of oxygen 3.Altered blood chemistry from nitrite exposure prevents fish from using oxygen 4. Viral, bacterial, parasitic, or fungal infections 5. Mortality from high pH 6. Mortality from pH fluctuations 7. Mortality from ammonia toxicity 8. Toxicity of unspecified substances 9. Starvation due to inadequate food resources
Metals • Sediments • Nutrients • Dissolved oxygen • Temperature • Ionic strength • Flow alteration • Unspecified toxic chemicals Listing advice for candidate causes • 8 common candidate causes • Basic information: • Definition of candidate cause • Sources • Site evidence • Biological effects • When to exclude • How to measure • Relevant literature reviews • Generic conceptual model
SOURCE STRESSOR BIOTIC RESPONSE Developing a conceptual model • What is it? • Diagram showing cause-effect linkages among sources, stressors, & biological effects • Used for: • Initial brainstorming • Analysis framework • Communication tool
origination points, areas, or entities that release or emit agents changes that affect delivery of agents to stream other stressors that influence or are influenced by the focal stressor stressors that directly induce biological effect of concern biological results of exposure to proximate stressor Conceptual model components in CADDIS
Using the conceptual models in CADDIS • The stressor-specific diagrams are there to give you ideas, & get you thinking about what may be happening in your stream • Take the parts that make sense for your system & leave the rest • Pilfer & modify freely, to generate case-specific diagrams
industrial processes riparian devegetation instream deposits channel alteration watershed devegetation detention basins landfill leachate impervious surfaces instream impoundment lawn care & landscaping sanding, salting & plowing ↑ temperature ↓ dissolved oxygen ↓ large woody debris ↑ autochthony ↑ sediment Δ flow regime 2 5 ↓ allochthonous food resources ↑ toxic substances ↑ suspended sediment 6 Δ water velocity ↑ rate or magnitude of flow fluctuations 1 ↑ autochthonous food resources ↑ deposited sediment ↑ organics ↑ metals ↑ pesticides 7 ↓ wetted channel ↓ water depth 3 4 ↑ ionic content ↑ NaCl ↑ NH3 ↓ EPT taxa ↑ non-insect taxa ↑ HBI score ↓ brook trout Case-specific conceptual models: Long Creek, ME
lawn care & landscaping industrial processes instream deposits watershed devegetation channel alteration instream impoundment detention basins landfill leachate sanding, salting & plowing impervious surfaces riparian devegetation ↑ temperature ↓ dissolved oxygen ↓ large woody debris ↑ autochthony ↑ sediment Δ flow regime ↓ allochthonous food resources ↑ toxic substances ↑ suspended sediment Δ water velocity ↑ rate or magnitude of flow fluctuations ↑ autochthonous food resources ↑ deposited sediment ↑ organics ↑ metals ↑ pesticides ↓ wetted channel ↓ water depth ↑ ionic content ↑ NaCl ↑ NH3 ↓ EPT taxa ↑ non-insect taxa ↑ HBI score ↓ brook trout Case-specific conceptual models: Long Creek, ME
source fertilizer use landfill leachate municipal waste industrial effluent channel modification hazardous waste site leachate combined sewer overflow ↑ nutrients (N and/or P) ↑ total ammonia (NH4+ + NH3) additional step in causal pathway ↑ pH ↑ channel incision ↑ BOD ↑ TOC ↑ UV light KEY response proximate stressor Case-specific conceptual models: Little Scioto River, OH ↑ sediment ↑ algae ↓ woody debris ↑ pool depth 4 ↑ un-ionized ammonia (NH3) ↑ metals ↑ PAHs ↓ riffles ↓ dissolved oxygen 1 2 3 5 6 7 ↑ fish weight ↑ DELT anomalies ↑ % tolerant invertebrates ↓ % mayflies
Things to keep in mind in model development • Think about causal pathways • How do sources lead to stressors? • How do stressors lead to biological effects? • Be as specific as possible • You do not need data for every component in your diagram • Want to identify potential data sources & types of evidence • General vs. specific impairments • Be thorough & inclusive • You can always eliminate potential sources, pathways, etc. later on, but don’t limit your initial brainstorming
forest forest dairy farm PC1 subdivision NC1 Pretend Springs city limit forest NC2 unimpaired site impaired site PC2 WWTP industrial facility dam Let’s go back to Pretend Creek…
subdivision urbanization dam KNOWN SOURCES industrial facilities dairy farm Candidate cause – hypothesized cause of impairment Proximate stressor – stressor that directly induces biological effect of interest ↓ EPT richness ↓ trout abundance KNOWN IMPAIRMENTS Developing a conceptual model for Pretend Creek CANDIDATE CAUSES?
subdivision urbanization dam KNOWN SOURCES industrial facilities dairy farm ↓ EPT richness ↓ trout abundance KNOWN IMPAIRMENTS Developing a conceptual model for Pretend Creek ↓ dissolved oxygen ↑ temperature ↑ metals EXAMPLE CANDIDATE CAUSES
Let’s give it a try… • Break into groups – 1 group per poster • Arm yourselves with sharpies • Mark up posters to generate conceptual models for Pretend Creek
origination points, areas, or entities that release or emit agents changes that affect delivery of agents to stream other stressors that influence or are influenced by the focal stressor stressors that directly induce biological effect of concern biological results of exposure to proximate stressor Conceptual model components in CADDIS
dairy farm deicers urbanization subdivision pesticides dam ↑ metals septic systems industrial facilities industrial leachate industrial effluent animal wastes ↑ impervious surfaces ↑ nutrients ↑ primary producers ↓ riparian cover ↑ heated surface runoff ↑ toxics in surface runoff ↑ respiration & decomposition ↑ water retention ↑ temperature ↓ dissolved oxygen ↑ DELTs ↓ brook trout abundance ↓ metal-sensitive taxa ↓ coldwater taxa ↓ DO-sensitive taxa ↓ EPT richness ↑ parasitism & disease ↑ gasping behavior