Download
1 / 23
240 likes | 384 Vues
Statistics and Simple Plots. Outline. Announcements: Homework II: due Wed. by 5, by e-mail Cookie Challenge Statistics Simple plots Tutorial 4. Homework II. myfft.m Inputs: x, t (a signal) Outputs: a, b, (Fourier coefficients) f (Frequencies) FourierMat.m Inputs:

E N D
Outline Announcements: Homework II: due Wed. by 5, by e-mail Cookie Challenge Statistics Simple plots Tutorial 4
Homework II myfft.m Inputs: x, t (a signal) Outputs: a, b, (Fourier coefficients) f (Frequencies) FourierMat.m Inputs: a, b, f (Fourier coefficients & frequencies) t (a vector of times) Outputs: x (signal at times in t)
Homework Policy You may discuss problems sets with others in the class BUT--write-up should be done alone
Statistics Descriptive summarize properties of data Comparative compare data sets test hypotheses
Descriptive Stats Most common descriptive stats are in “datafun” toolbox mean, median, min/max, std vectorized, operate on columns Ex: x & y are column vectors with data m=mean([x,y]) m(1)=mean of x, m(2)=mean of y Can force mean to work on rows: m=mean([x,y],2);%mean along 2nd dimension
Descriptive Stats The descriptive stats functions don’t like nans mean([nan;x]) returns NaN The statistics toolbox has nanmean, nanmin, nanstd,etc. that ignore nans Simple to write your own versions
Basic Comparative Stats Curve fitting with polyfit coefs=polyfit(x,y,n):%fits n-th order polynomial to data [x.^n, x.^n-1,…,x,1]*coefs ~ y Correlation coefficient (r) with corrcoef r=corrcoef([x,y]); r=[ r(x,x), r(x,y); r(y,x), r(y,y)] will also return probability
“Advanced” Comparative Stats Statistics toolbox has functions for statistical distributions parameter estimation statistical tests A useful function: regress--like polyfit, but get stats (p, R2) Fits any linear model (anything you can write as a matrix-vector product b=regress(y,X) finds b s.t. X*b ~ y
Fitting Polynomials with \ • x,y are (column) vectors of observations • X=[x.^3 x.^2 x.^1 x.^0]; %matrix • If we know b: • y=X*b; • Instead, we know y: • b=X\y • Matrix division--Matlab computes the inverse of the matrix • \ is very smart--can deal with a variety of matrices in a very intelligent manner.
Summary of Matlab Stats Matlab has basic stats built-in Can expand with the stats toolbox Most statistical tests are easy to program Can program Matlab to deal with your data! look for vector-products!
Simple plots Plot 1D functions (2D data) with plot plot(x,y) plots (x,y) with a blue line plot(y) is plot([1:length(y)],y) plot(x,[y1,y2,y3]) plots (x,yX) each in a different color
Customizing plot plot(x,y,’r’) is a red line plot(x,y,’o’) plots circles rather than lines plot(x,y,’yp’) plots yellow pentagrams Type help plot to get more options
Specialized 1D graphics bar--bar chart pie--pie chart polar--polar coordintes semilogy, semilogx, loglog--plotting with log-scales
2D basics Assume data Z is on a regular grid defined by X and Y pcolor, imagesc, contour plot in 2D surf, mesh plot in 3D (perspective)
2D graphics use colors to represent data Color of z is defined by a colormap and caxis several built-in colormaps--help graph3d Used in Lecture 01 2D basics
Generic graphics functions xlabel, ylabel, title label your plots hold on--allows multiple plots on same axes clf clears the figure window axis([xmin,xmax,ymin,ymax]) controls axis limits
Multiple plots subplot(m,n,j) creates the jth plot in an m-by-n matrix of plots n=col m=row
Axes & Figures Matlab plots into figures figure(n) makes n the current figure or creates a figure numbered n Figures contain axes If no axes exist in current figure, then any graphics call will create one Can explicitly create with subplot or axes
Printing figures print will send gcf to printer (or use GUI) print -depsc fname.eps will save graphics in EPS format print -djpeg fname.jpg will save into JPG format
Summary of Matlab Graphics • Matlab has most standard plots built in • Also has advanced tools for visualization of high dimensional data • colors, light, isosurfaces, slices • The best thing about Matlab graphics are that they can be programmed • put graphics statements in functions for display or debugging • Take CIS 402!
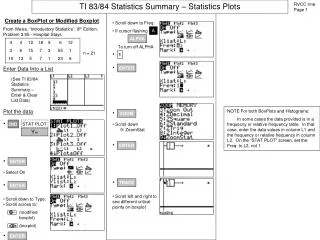
Jordan Basin Emerald Basin Wilkinson Basin Georges Basin Tutorial 4: Temp. on NW Atlantic Shelf • Data consist of yearly mean temperatures between 150-250m depth from 4 locations on NW Atlantic Shelf: • Are the temp’s independent? • Practice working with data, simple stats and graphics