Download
1 / 30
300 likes | 309 Vues
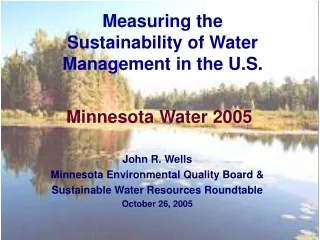
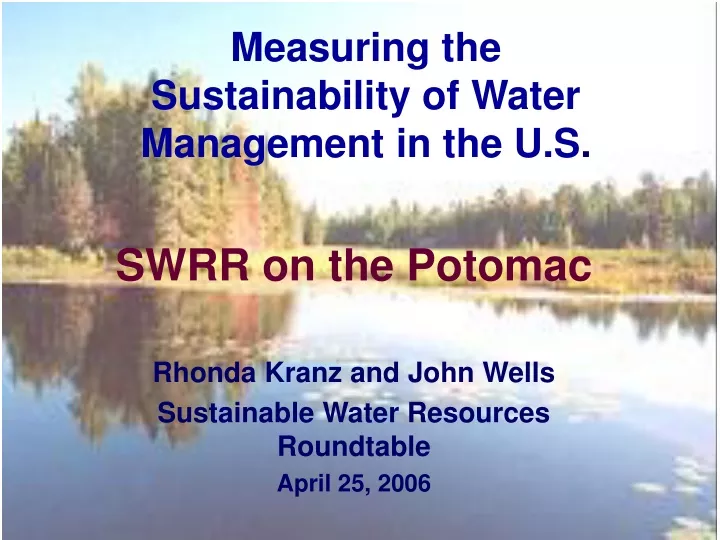
Measuring the Sustainability of Water Management in the U.S. SWRR on the Potomac Rhonda Kranz and John Wells Sustainable Water Resources Roundtable April 25, 2006. Sustainable Water Resources Roundtable.

E N D
Measuring the Sustainability of Water Management in the U.S. SWRR on the Potomac Rhonda Kranz and John Wells Sustainable Water Resources Roundtable April 25, 2006
Sustainable Water Resources Roundtable A national collaboration of federal, state, local, corporate, non-profit and academic interests
SWRR Progress • A conceptual framework for understanding water resources sustainability • Principles, criteria and indicators to support decision-making • Collaboration on research needs
Principles of Water Resources Sustainability • The value & limits of water People need to understand the value and appreciate the limits of water resources and the risks to people and ecosystems of unbounded water and land use
Principles of Water Resources Sustainability • Shared responsibility Because water does not respect political boundaries, its management requires shared consideration of the needs of people and ecosystems up- and downstream and throughout the hydrologic cycle
Principles of Water Resources Sustainability • Equitable access Sustainability suggests fair and equitable access to water, water dependent resources and related infrastructure
Principles of Water Resources Sustainability • Stewardship Managing water to achieve sustainability challenges us in meeting today’s needs to address the implications of our decisions on future generations and the ecosystems upon which they will rely
Outreach • 300 active participants from federal, state and local governments; corporations; nonprofits and academia • Meetings in California, Minnesota, Michigan, Washington DC, Maryland, Virginia • Publications and conference presentations
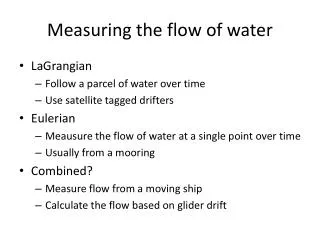
General Systems Perspective Biophysical Environment Economic System Ecosystems Social System
Ex: Fisheries Systems Perspective Biophysical Environment Aquatic Ecosystem Economic System Social System for Fishery Management Economic System for Fishing Social System
Information Pyramid Fewer Pieces Of Information Stories Criteria Indicators More Pieces Of Information Measurements
Major Categories of Indicators • System capacities and their allocation • Consequences of water allocation • Effects on people • Underlying processes and driving forces • Composite sustainability assessment
Social Institutional Capacity: Water law and rights Regulation of appropriations Social Infrastructural Capacity: Drinking water and wastewater treatment capacity Gross Water Availability: Precipitation Water in the Environment: Quality/Quantity streams, lakes, wetlands & aquifers Net Water Availability: Water available for people Water Withdrawals for Human Uses: Total withdrawals for all purposes Water Uses And Reuses Treatment Treatment Return Flows: Return water & physical, chemical and biological pollutant loading System Capacities and Their Allocation Example Indicators
System capacities and their allocation • Gross water availability • Total withdrawals for human uses • Water remaining in the environment after withdrawals and consumption • Water quality in the environment • Total capacity to deliver water supply (i.e., infrastructure capacity) • Social and organizational capacity to manage water sustainably
Figure 4.1.1. Available Precipitation Source: S. Roy, K. Summers and R. Goldstein
Consequences of Water Allocation Water in the Environment Water Uses And Reuses: Municipal and industrial use Water Withdrawals For Human Uses Return Flows Environmental Conditions: Water quality Biodiversity Water Dependent Resource Uses: Fish consumption Water Dependent Resources and Conditions: Fish stocks Aesthetics Water Dependent Resource Harvests: Fish landings Water Condition Dependent Uses: Sailing Example Indicators
Consequences of the way we allocate water capacity • Environmental conditions • Resource conditions • The quality and quantity of water for human uses • Resources withdrawals and use
Figure 4.8.1 Capacity of Water Resources to Support Human Use Source:U.S. Environmental Protection Agency, National Water Quality Inventory 1998 Report
Effects on People Water Uses: Cropland irrigation Value of Goods and Services Produced with Water: Value of produce and processed foods Health Effects: Nutritional value Exposure to toxic chemicals Incidence of drowning Value of Goods and Services Produced With Resources: Food & recreational value Water Dependent Res. Uses: Fishing Water Condition Dependent Uses: Sailing Value of Uses Dependent on Water Conditions: Boating expenditures Recreational value Example Indicators
Effects on people of the conditions and uses of water resources • Human conditions – measures of the value people receive from the uses of water and the costs they incur, including health effects
Figure 4.11.2 Reported Incidence of Waterborne Disease
Ecosystem Processes& SocietalDrivers Ecosystems Society Natural Processes: Disturbance & Response Energy Cycling Hydrologic Cycle & Flow Regime Materials Cycling Social & Economic Drivers: Economic Development Energy Production and Use Land Use Population Growth Transportation Ecosystem goods & services time time Human alterations & discharges
Underlying processes and driving forces • Land use • Residual flows – the flow of water and wastes back into the water system • Social and economic processes – the systems people and organizations develop to influence water resources and sustainability • Ecosystem processes
Figure 4.12.3 Watersheds with a High Potential for Pesticide and Nitrogen Leaching
Composite sustainability assessment • Water use sustainability – in each watershed, the ratio of water withdrawn to renewable supply • Water quality sustainability – in each watershed, indicators of the suitability of water quality for the uses desired, including ecosystem uses
Figure 4.16.1 Water Use Sustainability Withdrawals as a % of available precipitation, 1995 Figure 4.16.1 Total Freshwater Withdrawal in 1995 (as a percent of available precipitation) Source: S. Roy, K. Summers and R. Goldstein
The Work Ahead • Complete, revise and refine indicators • including indicators scalable to national, state and local levels • Assist agencies • describing the need for programs to collect the information necessary for generating indicators • Increase representation • incorporating indicators of regional water management programs
Future Work, cont’d • Expand relationships with the scientific community • Consult with other programs on water related indicators • National Research Council Key National Indicator Initiative • Council on Environmental Quality • Heinz Foundation • Plan a National Forum
Contact Information • John.wells@state.mn.us John Wells • Kranz@kranzcons.com Rhonda Kranz • http://water.usgs.gov/wicp/acwi/swrr