Download
1 / 59
590 likes | 594 Vues
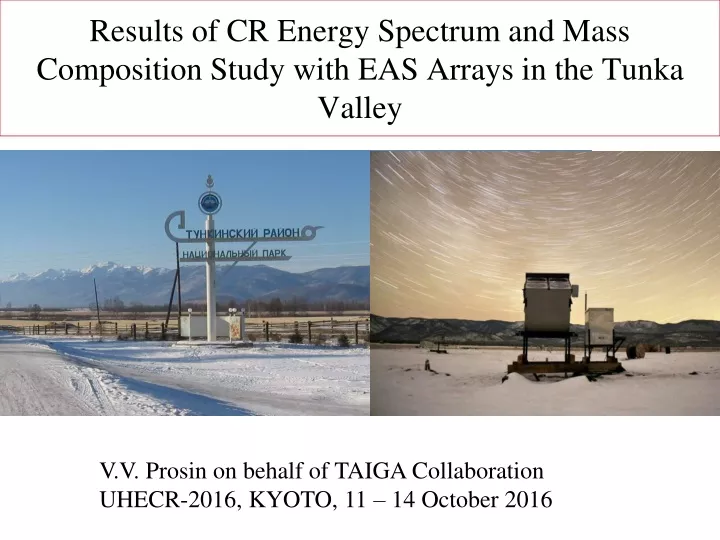
Results of CR Energy Spectrum and Mass Composition Study with EAS Arrays in the Tunka Valley. V.V. Prosin on behalf of TAIGA Collaboration UHECR-2016, KYOTO, 11 – 14 October 2016. TAIGA = T unka A dvanced I nstrument for cosmic rays and G amma-ray A stronomy. TAIGA - collaboration.

E N D
Results of CR Energy Spectrum and Mass Composition Study with EAS Arrays in the Tunka Valley V.V. Prosin on behalf ofTAIGA Collaboration UHECR-2016, KYOTO, 11 – 14 October 2016
TAIGA = Tunka Advanced Instrument for cosmic rays and Gamma-ray Astronomy
TAIGA - collaboration Germany Russia Hamburg University(Hamburg) MSU(SINP)( Moscow) DESY (Zeuthen) ISU (API) (Irkutsk) MPI (Munich) INR RAS(Moscow) JINR (Dubna) Italy MEPHI(Moscow) Torino University (Torino) IZMIRAN (Moscow) Rumania BINR SB RAS Novosibirsk) ISS (Bucharest) NSU (Novosibirsk)
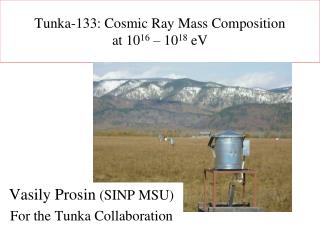
Tunka Valley Republic Buryatia 150 km from Irkutsk 50 km from the shore of lake Baikal 1 km 675
Complex of Arrays in Tunka Valley (50 kmfrom the lake Baikal) 10 18 eV Tunka-133 TAIGA-Grande Tunka- REX TAIGA –HiSCORE TAIGA -IACT Cosmic rays 10 15 eV Gamma-ray astronomy 10 13 eV
Tunka-133 1 km 175 optical detectors EMI 9350andHAMAMATSU Ø 20 cm 675
Tunka-HiSCORE(2015-2016) – 28stations All the stations are tilted for 25° to the South for observation of Crab Nebulae About 20-60 γ-events from Crab are expected during 100 h of observation.
Tunka-REX Connection of 2 antennas to 2 freechannels ofFADC 63 antennas are installed. 57 antennasare situated at the area of 1 km2 now.
Tunka-Grande 19 stations 228 detectors (0.64 m2 ) on the surface 152 detectors undeground (muons detectors), total area = 100 m2 Entrance to Muon detector
TAIGA- prototype 2015 – 2016 – 28 stations 2017 – 58 station will be inside the area of 0.6 km2 and one IACT All station are tilting to the South on 25 deg
Tunka-133 Single detector readout:Fitting of the pulse and measuring of the parameters: Q=c∙Spulse, Amax, ti , τeff=S/A/1.24 Time step = 5 ns Spulse anode: ti Amax dynode:
CORSIKA: Function LDF and ADF ADF: A(R) = A(400)·((R/400+1)/2)-bA steepness bA LDF: Q(R) = Q(300)·((R/300+1)/2)-bQsteepness bQ bA > bQ
CORSIKA: recalculation from Q200 to E0 E0=C·Q200g g = 0.94±0.01
Single event example Plan ADF and LDF Curve EAS time front provides δθ<0.5° τeff vs. core distance A ADF LDF
Effective areas 450 m - M 800 m - L
Tunka-133 Experimental Data 6 winter seasons: 2009-2010 , 2010-2011, 2011-2012, 2012-2013, 2013-2014, 2015-2016 303 clear moonless nights ~ 1850 h of observation with a trigger frequency ~ 2 Hz ~12 000 000triggers The cuts for the energy spectrum used: θ≤ 45° M: Rcenter < 450 m: ~ 320 000 eventswith E0 > 6·1015 eV – 100% efficiency ~ 117 000 events E0 > 1016 eV ~ 4700 eventsE0 > 5·1016 eV ~ 1150 events E0 > 1017 eV L: Rcenter < 800 m: ~ 14600 eventsE0 > 5·1016 eV ~ 3581 events E0 > 1017 eV
EAS parameters accuracy: experimental estimations by chessboard method Separation to two sub-arrays: a) odd detectors b) even detectors - comparison of EAS parameters: Error=Difference/√2 Lines – threshold for spectra
Spectrum systematic uncertainty E0=C·Q200g g = 0.94±0.01 Uncertainty of g is due to unknown exact mass composition.
Energy spectrum: power law fitting . Probability of power law fitting is 0.02 only from χ2 analysis.
Energy spectrum: Sharp features reflecting the termination energy for different elemental groups at one of the sources . 1 : 2 : 26 Z: p He Fe
Energy range expanding To expand the energy range of mass analysis: 1. 1015 – 1016 – Tunka-HiSCORE-28 – adapting of Tunka-133 methods to the new array. 2. 1017 – 1018 – Total time duty measurements by Tunka-Rex and Tunka-Grande. Rate of data acquisition will be 20 times higher than for Cherenkov light experiment (4000 events/year).
HiSCORE-28 stations layout. HiSCORE = High Sensitivity COsmic Ray Explorer - HiSCORE-9 – 2013-2014
Array field of viewwith stationstiltedto 25ºto the South. - Crab trace in the Array aperture (interval– 1 hr).
Pulse Trace All stations synchronized 100 MHz signal.
Recorded pulse delay t_ns = timer + t_opt -t_nrm + t_add Measurement of t_add at the trace Summed anode (ordynode) pulse. Step is0.5ns. Synchronized 100 MHz signal.
Fiber optics line lengtht_opt measurements. timer: 14:23:35.745.563.720 GPS synchronization It is measured few times during the observational season with accuracy of 0.1 ns. Time stable inside 0.1 ns. Total time measurement accuracyis about 0.2 ns (by the LEDpulses).
October 2015 – February 2016 experimental data: 35 clear moonless nights – 210 h ofthe array operation About 2·108 separate station triggers Off-line“merging”of shower events: ~ 1·107 pulse coincidences from 4 and more stations inside the time gateof 2 mcs. The main EAS parameters reconstruction: 7845780 showers inside the ellipse with the axis600 and 450 mand effective angleθ < 30º.
Watching of International Space Station ISS traces in the sky during ~ 1 s Time front reconstruction 3º x 3º sky view
PCR integral intensity for energy more than 2·1015eVfor different ranges by zenith anglesθ. Relative units θ°
Energy spectrumPRELIMINARY 1. θ< 15° E0 ≤ 1015 eV – 1300000 EAS Among them450000 with E0 > 2.5·1014 eV 2. θ< 40° 162500EASwith E0 ≥ 1015 eV θ< 15° θ<40°
Energy Spectrum: Comparison of Experiments in Wide Energy Range
Tunka-REX EAS energy measurement by the radio emission
Tunka-REX Correlation of the shower energy reconstructed with Tunka-Rex radio and Tunka-133 air Cherenkov measurements: ECL – ERadio = (17 ± 2) % ECL
Tunka-Grande Scintillation detectors for EAS electron and muon measurements. (Former EAS-TOP and KASCADE-Grande detectors)
Tunka-Grande: Surface and underground detectors of EAS electrons and muons