Download
1 / 56
560 likes | 564 Vues
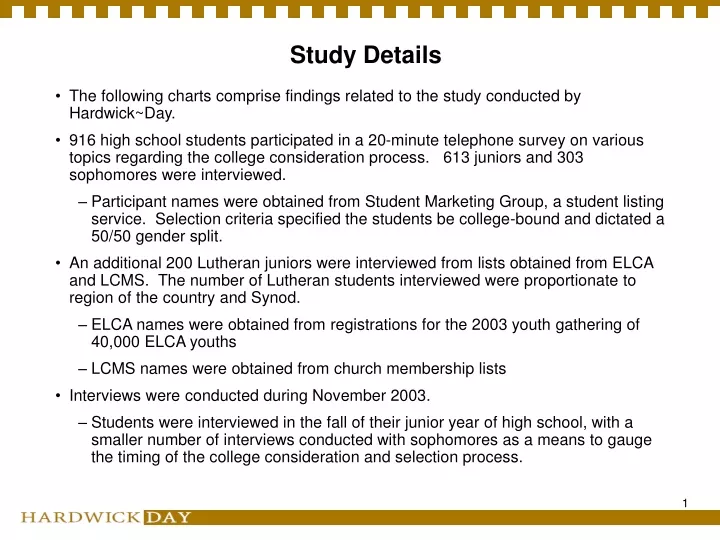
Study Details. The following charts comprise findings related to the study conducted by Hardwick~Day. 916 high school students participated in a 20-minute telephone survey on various topics regarding the college consideration process. 613 juniors and 303 sophomores were interviewed.

E N D
Study Details • The following charts comprise findings related to the study conducted by Hardwick~Day. • 916 high school students participated in a 20-minute telephone survey on various topics regarding the college consideration process. 613 juniors and 303 sophomores were interviewed. • Participant names were obtained from Student Marketing Group, a student listing service. Selection criteria specified the students be college-bound and dictated a 50/50 gender split. • An additional 200 Lutheran juniors were interviewed from lists obtained from ELCA and LCMS. The number of Lutheran students interviewed were proportionate to region of the country and Synod. • ELCA names were obtained from registrations for the 2003 youth gathering of 40,000 ELCA youths • LCMS names were obtained from church membership lists • Interviews were conducted during November 2003. • Students were interviewed in the fall of their junior year of high school, with a smaller number of interviews conducted with sophomores as a means to gauge the timing of the college consideration and selection process.
Regional Definitions West: • California, Oregon, Washington, Idaho, Arizona, Nevada and Colorado Midwest: • North Dakota, South Dakota, Nebraska, Minnesota, Iowa, Kansas, Missouri, Illinois, Indiana, Ohio Southwest: • New Mexico, Oklahoma, Texas Northeast: • Maine, Vermont, New Hampshire, Massachusetts, Connecticut, Pennsylvania, New York, New Jersey Southeast: • Delaware, Maryland, Washington, D.C., Virginia, North Carolina, South Carolina, Florida, Georgia, Alabama
Participant Social Profile Sophs Jrs Luths W MW SW NE SE Female 57% 55% 50% 55% 52% 61% 57% 54% Male 43% 45% 50% 45% 48% 39% 43% 46% Neither parent college grad 42% 40% 33% 47% 38% 46% 35% 39% One parent college grad 29% 24% 23% 17% 29% 32% 27% 20% Both parents college grads 28% 35% 45% 37% 33% 22% 38% 41% Church member 64% 67% 95% 58% 71% 65% 68% 71% Catholic 28% 27% - 20% 26% 30% 42% 18% Lutheran 5% 5% 100% 6% 8% 2% 3% 1% Christian 12% 9% - 16% 5% 9% 7% 11% Baptist 10% 10% - 1% 6% 22% 5% 22% None 16% 20% - 31% 20% 17% 19% 12% Live with: Both parents 78% 80% 86% 81% 80% 70% 86% 82% Single parent 14% 11% 9% 9% 12% 17% 11% 10% Median household income $60,000 $63,000 $65,000 $57K $59K $56K $67K $68K Caucasian 74% 73% 93%54% 88% 52% 87% 71% Hispanic 11% 10% 2% 14% 3% 34% 4% 5% African American 6% 6% 1% 4% 3% 6% 3% 15% Asian 3% 4% 2% 15% 2% 1% 2% 2% Political views: Liberal 22% 23% 21% 27% 24% 21% 21% 22% Moderate 39% 41% 40% 37% 40% 41% 47% 38% Conservative 26% 23% 26% 19% 27% 24% 20% 26% Don’t know 13% 13% 13% 17% 10% 14% 12% 14% Live In: Small town 40% 40% 47% 45% 42% 35% 35% 40% Suburb 33% 32% 23% 30% 29% 31% 38% 33% Rural area or farm 14% 17% 22% 10% 20% 12% 19% 18% Large urban city 13% 11% 8% 13% 9% 21% 7% 8% n= 303 613 231 115 153 100 118 136
Participant School Profile Sophs Jrs Luths W MW SW NE SE Public high school 92% 88% 92% 87% 85% 96% 84% 90% Private religious 7% 9% 5% 8% 14% 2% 14% 5% High school size Below 600 17% 18% 28% 14% 25% 20% 14% 17% 600-899 11% 11% 9% 4% 16% 8% 16% 7% 900-1499 19% 20% 15% 23% 22% 8% 25% 18% 1500-2099 22% 21% 21% 27% 12% 19% 20% 27% 2100 or more 22% 19% 19% 22% 15% 28% 18% 18% Classes have taken: Advanced placement 41% 48% 52% 46% 45% 48% 49% 52% International baccalaureate 4% 5% 3% 6% 6% 3% 5% 7% College (while in high school) 16% 27% 27% 35% 24% 22% 28% 25% Cumulative GPA Below 3.0 10% 10% 11% 18% 9% 4% 3% 16% 3.0 - 3.249 16% 15% 12% 18% 18% 9% 12% 16% 3.25 - 3.749 21% 25% 31% 24% 34% 16% 21% 24% 3.75 or higher 24% 23% 31% 25% 27% 13% 15% 32% No system/ don’t know 29% 26% 15% 14% 13% 58% 48% 13% Graduate school plans 58% 56% 58% 57% 47% 54% 62% 61% Student works 23% 42% 45% 35% 54% 27% 46% 38% Avg. hours/wk 16.8 16.5 15.3 15.4 16.4 18.4 16.5 17.2 n= 303 613 231 115 153 100 118 136
How Lutherans Differ From the Total Junior Sample • Lutheran families are more highly-educated, with 45% of households having both parents as college graduates (vs. 35% of total juniors). • Lutherans are more likely to be church members. Much of this difference is due to the sampling method. • Lutherans are more likely to be Caucasian. • Lutherans are less likely to live in suburban areas, and slightly more likely to live in small towns or rural areas. • Subsequently, Lutherans are more likely to attend smaller high schools, especially with under 600 total enrollment. • Lutherans tend to have higher grade-point averages, but some of the difference is because a lower percentage of Lutherans say they do not have a GPA system. This could also be impacted by where they live.
At This Point, Most Students Have Not Made a Definite College Decision • Two in five sophomores do not have a clear idea of the type of college or university they’d like to attend. • By the junior year, this has reduced to less than one in three. • One in ten sophomores and one in seven juniors already know which college or university they want to attend. • Of these, two-thirds of sophomores and half of juniors name a large public institution. • One in five in each age group name a private college or university. • The remainder mention two-year colleges or other unknown institutions. • One junior already plans to go to a Lutheran college. • Lutheran juniors respond similarly to the junior group as a whole on this question. Q. 3 Which of the following best describes how much thought you’ve already given to what college or university you might attend? If students haven’t given it any thought (6% of juniors), or have decided not to attend college (2%), they were not included in the study.
Students Expect to Participate in Many Activities in College • Students were asked to list extracurricular activities in which they plan to participate. • Over half listed athletics, especially intercollegiate athletics. • This percentage of intercollegiate participation is unrealistically high if they attend a public institution. • Sophomore males are especially likely to think they will participate in intercollegiate sports; by the junior year the males’ percentage drops somewhat to be similar to females’. • Academic clubs or band/orchestra appeal to a similar number, at about one in six. • Just less than one in ten plan to be involved in choir, and this percentage is not different for Lutherans. • Other activities not shown are mentioned by less than 5%. • Religious studies or youth ministry are mentioned by 2% of sophomores and 4% of juniors and Lutherans. Q. 9 While at college, what are some of the extracurricular activities in which you plan to participate?
There Are Many Regional Differences in Expected Participation in College Activities • For juniors living in the West, sports are less important, and band, choir, dance and clubs are more important. • For Midwestern juniors, only sports stand out as more important. • Southwestern juniors are less likely to be interested in sports and list the fewest activities of all groups. • Of all groups, Northeastern juniors are most interested in sports, and they are also more interested in drama or theater and community service. • At 23%, Southeastern juniors are twice as likely as other groups to be interested in academic clubs; they are also more interested in community service. • Students with higher GPAs are interested in slightly more activities.
Sophomores and Juniors Agree on How They Would Like Colleges to Help Them Grow As a Person • Students were asked to rate the importance of different skills. • Two in three rate “the ability to think independently” as “very important”--the highest of all skills rated. • Acceptance of different people and improving self-confidence are also very important to a majority. • Lutherans are less likely to place great importance on developing teamwork skills through participation in music or sports, or to have the ability to adapt to different settings. • Developing spirituality and growing faith are very important to about three in ten overall, especially Lutherans. • However, thereis a very different pattern between the two items: females are nearly twice as likely as males to find developing their own spirituality as important, but a roughly equal number of males and females wish to grow their faith through worship and service. Q. 5 In addition to academics, some colleges also strive to provide opportunities for you to grow as a person. Please tell me how important each of the following skills is to you. (Rating a “5” on a five-point scale, where 1=not at all important” and 5= “very important” to you).
Messages May Need to Be Adapted for Regional Differences • For juniors living in the West, acceptance of people who are different from them is a highly important skill. • For Midwestern juniors, none of the skills is more important. • At 41%, Southwestern juniors are far more likely than other groups to be interested in growing their faith through worship and service. • Of all groups, Northeastern juniors are least interested in developing their spirituality or growing their faith through worship and service. • Southeastern juniors give many of the skills higher importance ratings than residents of other regions. • The only skills ratings that fail to vary between junior regional groups are those for the ability to think independently and developing teamwork skills. • It is more important to Catholics than Lutherans to improve their self-confidence, develop teamwork skills, and to participate in community service projects. • It is more important to Lutherans than Catholics to growth their faith through worship and service.
Sophomores Are More Likely to Say They’d Like a Lot of Extracurricular Options • Students were asked if they had to make a choice, which would they choose, having a lot of extracurricular options or a higher likelihood that they’d have a chance to participate. • Sophomores are looking for lots of options, while juniors are fairly evenly split. • Lutheran juniors are somewhat more likely to lean toward having a chance to participate. • Other groups more interested in having a chance to participate include lower income juniors, Midwest residents, and those whose parents are college graduates. Q. 8 If you had to make a choice, which is more important to you ?
Junior Females Are Most Likely to Be Interested in Good Faculty Advising There are no gender differences among Lutherans • Students were asked if they had to make a choice, which would they choose, having a lot of majors from which to choose, or good faculty advising to help them choose a major that is right for them from a smaller list of options. • While sophomores are fairly evenly divided, juniors tend to lean toward good faculty advising. • However, the good faculty advising is more important to junior females than males, by a wide margin. • Interestingly, this gender difference did not appear among sophomores or Lutheran juniors. • Good faculty advising is also more important to Lutheran juniors than having a lot of majors. • Other groups more interested in good advising include lower income juniors and Southwestern residents. Q. 8 If you had to make a choice, which is more important to you ?
Most Appealing College Characteristics to Juniors? Close to Home, Located in a Large City and Publicly-Funded • Students were asked if learning these characteristics about a college would make them more or less interested in the college, or have no impact. • For close to home, a large city and a state school, a higher percentage of juniors are more interested than less interested because of the statement. • About two in five juniors live in a large city or its suburb, and somewhat less than this say an urban location would make them more interested. • Female juniors are more interested in a college in a large city, and less interested in a school close to home. • Interestingly, “state school” is similarly appealing to males and females, but more appealing to higher income juniors. • “Private/independent,” “over 20,000 students on campus,” or “less than 4,000 students on campus” have a generally neutral effect. • Located in “a rural area” or “another state,” and “religious affiliation,” had a slightly higher likelihood to cause students to be less interested, at about three in ten. Q. 6 If you learned the following characteristics about a college, would it make you more or less interested in considering that college, or would it make no difference in your consideration?
There Are Differences by Region and Religious Affiliation • Northeastern juniors are morelikely to say that a private school, one located in another state, or a state school would make no difference in their consideration. Accordingly, fewer in this region than in others indicate these attributes would make them moreinterested in a college. • Midwestern and Southwestern juniors are also more likely than Northeastern juniors to say a “religious affiliation” would make them more interested. • Lutheran juniors (35%) are more likely than Catholics (20%) and those with no religious preference (7%) to say a “religious affiliation” would make them more interested. • This is more appealing to Lutheran females (41%) than males (28%).
Many Students Rely on Others’ Experience for College Advice • Students were asked if they are considering any colleges because someone they know attended or is planning to attend that college. • Over two in five sophomores and random juniors, and half of Lutheran juniors are considering a college because someone they know attended that college. • This is significantly lower among students whose parents did not graduate from college (32%). • This is more prevalent for all religious groups monitored, and significantly less for those with no religious affiliation (31%). • However, influencers are primarily family members and friends, and rarely specifically people from church (detail on next slide). • Another one-quarter of students are considering a college because someone they know is planning to attend that college. • This is especially true for lower income sophomores (36%), but not juniors, where there is no difference by income. Q. 30 Are you considering any colleges because someone you know… ?
Friends and Relatives Lead the List of People Who Will Have Some Influence Because they Attended or Will Attend a College • Students who are considering colleges because someone they know attended or is planning to attend that college were asked to name that person. • Friends, including boyfriends and girlfriends, top the list. • Family members follow, including siblings, parents, and other relatives (primarily cousins and aunts or uncles). • Family friends receive some mentions (2%-3%). • Very few students mention a high school teacher. • Less than 1% of any group mention a youth group leader or someone else from church. • Friends from church could be included among friends or friends of the family, however. Q. 31 And, who is that person? (based to total)
Flagship Public Universities Lead the Area Colleges or Universities Considered to Be the Best by Juniors • Students were asked which college or university in their area they consider to be the best. • Three in five juniors mention a public university, primarily a flagship doctoral university (46%). UCLA, UC-Berkeley, UT-Austin, U of Maryland, Ohio State and UNC-Chapel Hill receive the most mentions. • Males are more likely to mention a flagship public university (51% vs. 42% of females). • Of private institutions, the top doctoral universities receive 14% of mentions. Harvard, USC, Stanford and NYU are among those mentioned most often. • One in ten juniors mentions another private college, either masters level or baccalaureate. No college has more than one mention. • Although the numbers are small, students who had an extended learning experience are significantly more likely to mention a liberal arts college (5% vs. 2%). • Although no juniors in the random population mention a Lutheran college, 3% of Lutheran juniors mention a Lutheran college as best in their area. Q.10 In your area, what college or university do you consider to be the best?
There Are Vast Regional Differences in Which Area Colleges or Universities Juniors Consider to Be the Best • Students were asked which college or university in their area they consider to be the best. • The most obvious regional difference is in the Northeast, where private colleges are mentioned more often than public universities. • About half of the elite private institutions are located in the Northeast region. • Many of the liberal arts colleges are also located in the Northeast region. • Midwestern juniors are somewhat more likely to name a public institution, many of which are Big Ten schools. Q.10 In your area, what college or university do you consider to be the best?
Public Universities Lead the Area Colleges or Universities Considered “Safety Schools” by Juniors • Students were asked which college or university in their area they think of first when they hear “safety school.” • State universities slightly edge out flagship public universities in this category. • Males are more likely than females to mention flagship public universities. • Although “four-year” college was specified, it is not surprising that many (18%) students mention a community college or technical school. • The Northeast residents, who regard colleges so differently than the other juniors, are more likely to mention a two-year college as a safety school (25%). • Private institutions are much less likely to be mentioned; very few think of an elite private university in these terms. Q.11 When you think of “safety school,” which four-year college or university in your area comes to mind first?
Flagship Public Universities Lead the Area Colleges or Universities Considered “Party Schools” by Juniors • Students were asked which college or university in their area they think of when they hear “party school.” • Flagship public universities lead this category. • Midwest residents (50%) are most likely to mention flagship public universities. • All other state universities together make a distant second place. • Southeast residents (38%) are most likely to mention a university in this category. • Private institutions and two-year colleges are much less likely to be mentioned. Q.12 Which college or university in your area do you think of when you hear “party school?”
The Dominance of Public Universities Are Shown by the Proportion of Mentions as the “Best Liberal Arts College” • Students were asked what they think of as the best liberal arts college in their area. • Over half could not think of any. • Flagship public universities once again lead this category. • Southwest (19%) and Southeast (20%) residents are most likely to mention flagship public universities, while few (5%) in the Northeast make this claim. • Other state universities are mentioned more than private colleges. • Less than 1% mention one of the few public liberal arts colleges, however. • One in twenty mention a private liberal arts college. Similar percentages mention a masters-level or elite doctoral private college or university. • Midwest and Northeast students (7% each) are more likely than other regional groups to name a liberal arts college. • Lutherans, juniors with higher GPAs and those who had an extended campus experience are also more likely to name a private liberal arts college. Q.What do you think of as the best liberal arts college in your area?
Awareness of Lutheran Colleges is Much Higher Among Lutheran Juniors than Random Sophomores and Juniors • Students were asked to name the Lutheran colleges of which they are aware. • Nine in ten in the random population cannot think of any (saying “none” or “I don’t know”). • One in twenty (5%) in the random population correctly name a Lutheran college. • Over half (57%) of Lutheran juniors are able to name at least one Lutheran college; on average, those who know of any list two. • Luther, Pacific Lutheran and Texas Lutheran are the only Lutheran colleges mentioned by at least 1% of students, randomly. Q.14 What Lutheran colleges are you aware of?
Lutheran Colleges Throughout the Country Are Mentioned by Lutheran Juniors • Students were asked to name the Lutheran colleges of which they are aware. • Over half of Lutheran juniors named at least one Lutheran college. • There are no differences in awareness levels by Synod, GPA, income, or gender. • Among Lutheran juniors, St. Olaf and Luther have the highest awareness, along with Wittenberg, California Lutheran, Gustavus Adolphus and Valparaiso. • Many other Lutheran colleges are mentioned by 3% each. • All colleges displayed at right are mentioned by more than five Lutheran students. Q.14 What Lutheran colleges are you aware of? (Total Lutheran juniors)
ELCA Juniors Are Aware Of a Variety of Lutheran Colleges • Students were asked to name the Lutheran colleges of which they are aware. • Among ELCA juniors, St. Olaf, Luther and Wittenberg have the highest awareness, followed by Gustavus Adolphus, California Lutheran, Valparaiso and Augustana-Sioux Falls. • Many other colleges are mentioned by 4% of ELCA juniors. • All colleges displayed at right are mentioned by five or more ELCA juniors. Q.14 What Lutheran colleges are you aware of? (ELCA juniors)
LCMS Juniors Are Primarily Aware of Concordia System Schools • Students were asked to name the Lutheran colleges of which they are aware. • Among LCMS juniors, five Concordia institutions are mentioned by three or more students. • Concordia-River Forest, Concordia-Seward and Concordia-Irvine are mentioned by 10%. • California Lutheran is the only non-Concordia system university to receive this level of recognition, and is noted by both ELCA and LCMS students at similar levels. Q.14 What Lutheran colleges are you aware of?
The Vast Majority Agree with Statements Positively Showcasing Small, Private Colleges • Students were asked if they agreed or disagreed with these statements. • The groups are similar in their agreement that living on campus enriches the college experience, it is easy to make friends at a small college and large universities can be overwhelming. • Sophomores and Lutheran juniors seem more optimistic about the availability of scholarships and affordability of private colleges. • Large universities (68% juniors) are less likely than small colleges (80%) to be thought of as places where it is easy to make friends. • Students tend to agree large universities provide more opportunities to participate outside of class (63% juniors vs. 54% for small colleges). • Males are especially skewed toward large universities in terms of opportunities outside of class. Q. 7 Please tell me if you agree or disagree with the following statements about colleges or universities. (agree summary)
There Are Differences in Beliefs by Region and Religious Affiliation • Although still a majority, Western juniors are leastlikely to agree that it is easy to make friends at a small college. • Southwestern juniors are least likely to agree living on campus enriches the college experience, but are most likely to agree that small colleges provide substantial scholarships to make them affordable. • Northeastern juniors are leastlikely to agree large universities can be overwhelming. • Lutheran juniors are more likely than Catholics and those with no religious preference to agree that small colleges provide substantial scholarships to make them affordable. • Lower-income students, those from the smallest high schools, and juniors whose parents did not graduate from college are also more likely to agree that scholarships can make small colleges affordable.
Several Characteristics Juniors Rate as Very Important In College Consideration Are Done Best by Private Colleges • Students were read a list of characteristics and asked to rate their importance in their consideration of colleges. • There are no differences by group. • About half of juniors rate finishing in four years, faculty that get to know you, courses taught by actual professors, a program with a good placement record for jobs and graduate school, and attending with students who are motivated to do well as very important. • The characteristic, “faculty that really get to know you” is more important to females and lower income students. • Lower income students also put more importance on the school’s job placement record. • “An emphasis on values and ethics in campus life” is very important to one in four, and is also more important to females than males. Q.32 I’m going to read you a list of characteristics about a campus or college in general. For each one, tell me how important it is in your consideration of colleges. (Rating a “5” on a five point scale, where 1=not at all important” and 5= “very important” to you).
There Are Many Differences Across Groups in the Importance of Characteristics • Juniors whose parents did not graduate from college place higher importance on finishing in four years, faculty that get to know them, attending with students who are motivated to do well, and a good placement record for jobs and grad school. • Minority students also place greater importance on the first three noted above, as well as having courses taught by actual professors, developing career skills, and an emphasis on values and ethics. • Finishing college in four years is more important to students with lower GPAs and to Catholics. • Western juniors place more importance on several characteristics, including faculty that get to know them, developing career skills, attending with involved students, an emphasis on values and ethics, and a campus where music has a presence. • Northeastern juniors are lesslikely to believe it is important to attend with students who are motivated. • Southeastern juniors place greater importance on a program with a good placement record for jobs and grad school.
For the Most Part, Juniors See No Difference in Where These College Attributes Will Be Found • Students were asked where they thought they’d be most likely to experience each characteristic, at a smaller private college, a larger public university, or if there is no difference. • Juniors recognize small private colleges for faculty that really get to know you and courses taught by actual professors. • For all of the remaining characteristics, the majority see no difference between private colleges and large public universities. • This is especially true for the most important characteristic, finishing in four years. • Even so, more juniors think private colleges than public universities are likely to provide: • an emphasis on values and ethics in campus life • attending with students who are motivated to do well • attending with students who are involved, not just spectators • developing career skills like writing or critical thinking. • And more juniors think public universities than private colleges are likely to provide a: • program with a good placement record • campus where music has a major presence Q.33 Are you more likely to experience that at a larger public university, a smaller private college, or do you think there is no difference?
Students with Higher GPAs, College Graduate Parents, and Caucasians Give More Credit to Private Colleges • Juniors with higher GPAs, from families where both parents graduated from college, higher income, and Caucasians generally cite private colleges in higher percentages for faculty that get to know them, courses taught by actual professors, and an emphasis on values and ethics. • Caucasians are also more likely to cite private colleges as a place for attending with students who are motivated to do well, and involved students. • Lutheran juniors are more likely to indicate private colleges as having an emphasis on values and ethics and a higher likelihood of finishing in four years. • Southwestern juniors differ from other regions by often attributing the private college characteristics--faculty that get to know them, courses taught by actual professors, and an emphasis on values and ethics--to public universities. • Northeastern juniors are morelikely to say there is no difference between private colleges and public universities on most attributes.
Some Juniors Are Aware of Recent Funding Cuts at Public Universities, But Fewer See a Negative Impact • Students were asked about public funding for public education. • There are no differences by group. • One in four juniors say state university funding was recently cut in their state. • This is especially true in the West (45%) and Southeast (30%). • Half to two-thirds of students are unable to answer this question, primarily in the Midwest, Southwest and Northeast. • Over half of students who think there have been funding cuts think the cuts negatively impact quality of public education. • Students living in the West are twice as likely as the next highest region to see a negative impact. • Juniors whose parents are both college graduates are more likely to say there have been recent funding cuts, but the quality of education has not suffered. Q. 16 In your state, has state funding for public universities been cut recently? Q. 17 Do you think these cuts have weakened the quality of education at public universities?
Many Juniors Are Aware of Recent Tuition Hikes at Public Universities • Students were asked if there have recently been large tuition hikes at state schools. • Less than half of juniors say there has been large tuition hikes in their state. • Midwest juniors are most likely to agree, at 52%, compared to 39% in the Northeast. • Students from larger high schools are most likely to agree, while many from schools with less than 600 are unable to answer the question. • Lower-income juniors are also less knowledgeable, with 40% unable to answer the question (compared to 28% of higher-income juniors). Q. 18 Have state schools had large tuition hikes recently?
Juniors Have Had Much More Access to College-Initiated Interactions • Students were read a list of information sources and asked which ones they had used so far to gather information about colleges. • With the exception of phone calls, college-initiated sources are more common for juniors than sophomores. • Four in five juniors, and three in five sophomores have used college brochures and viewbooks, the most prominent source of information. • Lutheran juniors are more likely than other groups to have received a letter from a college. • Lutherans are as likely as other juniors to have a college visit their school, to have attended college fairs and to have received email from colleges. • Email was primarily information, such as an e-newsletter. Q.19A Please tell me what communication sources you have used so far to gather information about colleges. Have you used…
Self-Initiated Interactions Indicate that Sophomores Are Hungry for College Information • Students were read a list of information sources and asked which they had used so far to gather information about colleges. • The gap in usage between sophomores and juniors is much smaller on the items that are either self-initiated or open to everyone. • About three in five students have talked to someone; high school counselors (23%), friends (19%), parents (16%), and teachers (8%) lead the list. • More than two in five juniors have visited a college campus and one in three rely on college rankings. • Church is a prominent source for Lutheran juniors (39%). Comparatively few juniors of other religions noted this source: Catholics (10%), other Christians (27%). • However, only 3 Lutheran juniors (1%) voluntarily mention speaking to a pastor, and 1% spoke to a youth group leader about college. Q.19A Please tell me what communication sources you have used so far to gather information about colleges. Have you used…
Most Useful Sources for College Information? Word-of-Mouth and College Marketing Materials Top the List • Students were asked which one of the information sources they had used so far they found to be most useful. • The most common response for all groups is talking to someone; high school counselors (6%), friends (4%), and current students at a college (3%) lead the list. • 1% of Lutheran juniors mention talking to a youth group leader as most useful. • The importance of college-generated marketing materials is seen in the next two items: college websites and brochures/ viewbooks. • High school visits and college fairs are also high on juniors’ list of useful sources, followed by general websites, campus visits and letters from colleges. • All other sources are mentioned by less than 3% of juniors. Only 1%-3% of students say none of the sources has been useful. Q.20 Which one of the sources you’ve used so far did you find most useful?
Sophomores and Juniors Have Similar Preferences for College Communication Methods • Students were asked which of four different methods of communication with prospective students they most prefer. • Sophomores and juniors have remarkably similar responses. • Mail from the admissions office is the most popular method, especially among those with higher GPAs. • One in four prefer calls from admissions counselors and emails from different entities at a college. • Students whose parents did not graduate from college are more likely to prefer calls from admissions counselors over other methods. • Fewer students prefer calls from current college students. Q.28 I’m going to read you four methods colleges use to communicate with prospective students. Think about how you prefer to be contacted. Which of these do you most prefer?
Most Students Expect an Answer to an Email Query in One Week or Less • Students were asked how quickly they would expect an answer to an email question. • Nearly half of juniors and 40% of sophomores expect a reply in less than one week. • Nearly one in five juniors expects a response within one day. • Another one-quarter of students expect a reply in one week, for a total of two-thirds of sophomores and three-fourths of juniors who expect a reply in one week or less. Q. 27 If you asked a college a question electronically, how quickly would you expect a response?
One in Three Students Has Attended Some Form of Extended Learning Experience on a College Campus • Students were asked if they ever attended a camp or other extended learning experience on a college campus. • One in three students say they have attended such an experience. • There are no differences by income or region of the country. • Junior males (and Lutheran males) are less likely than females to have participated; this was not the case for the sophomores. • Students with higher GPAs, those with at least one parent who is a college graduate, and Caucasians are also more likely to have participated in an extended campus experience. • Christians (other than Catholics or Lutherans) are more likely than students with no religious affiliation to have participated on a campus. Q. 29 Have you ever attended a camp or other extended learning experience on a college campus?
The Majority of Students Have Multiple Strategies to Help Pay for College • Students were read a list of strategies they might use to pay for college. On average, students will use five or six of the eleven choices given. • The vast majority plan to use work earnings, both from college and high school. • More than two of three will use students’ and parents’ savings. • Families where both parents are college graduates are more likely to have parental savings. • Juniors are more likely to mention applying for financial aid, indicating they perhaps have a more evolved plan. • This is especially true of lower-income students, rising from 64% of sophomores to 83% of juniors who say they will apply. • Three in five hope to use college classes taken in high school to reduce some college requirements. Q.36 Have you already, or will you do any of the following to pay for college?
For Some Juniors, the College Plan Seems to Be Evolving Toward Including Trade-offs—Going to a Less Expensive College than They’d Prefer • Students were read a list of strategies they might use to pay for college. Several items are mentioned by less than half. • As with financial aid, more juniors than sophomores say their parents plan to take out loans. • More juniors than sophomores mention choosing a less expensive college, either to get the basics, then transfer or for their entire college career. • Both of these options are especially true of lower-income students, as well as those whose parents did not graduate from college. • Lutheran juniors, however, are less inclined than the random population to say they will choose a less expensive option, then transfer. • One in three students will use an inheritance, and one in six mention their parents worked with a financial advisor to specifically plan for college. Q.36 Have you already, or will you do any of the following to pay for college? (continued)
A Minority of Students Have Discussed How They Will Pay for College with Their Parents • Students were asked if they had talked specifically to their parents about how they will pay for college. • Two in five juniors have talked to their parents specifically about how they will pay for college. • This is especially true of juniors with higher GPAs (44% vs. 34% of lower GPAs). • There are no differences between sophomores and juniors on this question. • Few (7% of juniors) say their parents have set a spending limit. • There is a marked increase since the sophomore year in limit-setting, from 3% to 7%. • Among juniors, Southwest and Northeast residents are most likely to have spending limits imposed. Q. 35 Have you and your parents talked specifically about how you will pay for college? Q. 40 Have your parents set a limit on how much they’ll pay?
Although Tuition Will Impact the College Choice Set for Half, Fewer Juniors Have Already Eliminated Colleges on Price • Students were asked if the total tuition will have any impact on the set of colleges to which they choose to apply, and if they have already eliminated any colleges because of price. • Half of juniors indicate that the total published tuition will impact their college application choices. • This is somewhat (but not significantly) higher than sophomores (43%). • Interestingly, juniors who have had an extended campus learning experience are more likely to indicate the tuition will NOT have an impact (57%) on their decision. • One in five juniors (and 12% of sophomores) say they have already eliminated colleges because of the tuition price. Q. 41 As you consider colleges, will the total tuition as stated by the college in their materials--that is, their published price, have any impact in determining the colleges to which you apply? Q. 42 Have you eliminated any colleges primarily because of price?
Juniors Have a Slightly More Developed Idea of How Much They Will Consider Paying for College • Students were asked if they would consider a college at different total tuition levels. • Sophomores are more likely to say that price won’t have an impact (or they don’t know), therefore there are fewer responses at different price levels. • For juniors, the first big drop in interest occurs between $15,000 and $20,000 per year. • It is interesting that 5%-6% of all three groups stayed in at the highest level specified, $30,000 a year. • Although about half of each group says price won’t have an impact on their college selection, one must interpret this percentage with caution; price may not be an issue for some because they are only considering lower-priced public universities. Q.43 Would you consider a college if their total tuition price per year, including tuition and room and board, is…? Q. 41 Will the total tuition price have any impact in determining the colleges to which you apply?
The Majority of Students Expect to Pay at Least Half of their College Costs Themselves • Students were asked how much of their college costs they expect will be paid by their parents. There are no differences by age group. • Nearly half (46%) of juniors say their parents will pay “all” or “most” of their college costs. • One in ten say “all,” and this percentage is higher among the higher income group (13% vs. 4% of the lower-income group). • One in four juniors expects to split the costs equally with their parents. • Another one in four juniors expects their parents to pay some, but less than half of their expenses. • One in twenty expects their parents to pay nothing at all. • At 8%, junior males are twice as likely as females (3%) to fall in this group. • Among lower-income juniors, 43% expect to pay all or most of their college expenses without their parents help (parents will pay “some” or “none”), compared to 21% of higher-income juniors. Q.37 How much of your college costs do you think will be paid by your parents?