Download
1 / 35
410 likes | 703 Vues
Carbon Capture and Storage Martin Blunt Department of Earth Science and Engineering Imperial College London. 1. Carbon Capture and Storage Consortium UK, UKCCS. Geological storage of carbon dioxide. 736 Gt in North Sea alone (DTI). Why geological storage?.

E N D
Carbon Capture and Storage Martin Blunt Department of Earth Science and Engineering Imperial College London 1
Carbon Capture and Storage Consortium UK, UKCCS
Geological storage of carbon dioxide 736 Gt in North Sea alone (DTI)
Why geological storage? • Technology already established – many carbon dioxide injection projects in the world. • Allows smooth transition away from a fossil fuel economy. • Economic benefit of enhanced oil recovery. • Has potential to have a large impact on carbon dioxide emissions quickly. • Low emission option for developing countries – e.g. China and India who will invest in coal-burning power stations anyway.
Current oil field projects • 66 CO2 injection projects worldwide. • Many in West Texas. • Uses natural sources of CO2 from underground reservoirs. • Extensive pipeline infrastructure – several thousand miles of pipes.
Sleipner project (continued) • 1 million tonnes CO2 injected per year. • CO2 separated from produced gas. • Avoids Norwegian CO2 tax. • Gravity segregation and flow under shale layers controls CO2 movement.
Issues to address • How to separate carbon dioxide from the exhaust stream of a coal or gas-burning power station efficiently. • Investment in pipeline infrastructure. • Will the carbon dioxide remain underground? • Where will the carbon dioxide go and how can it be monitored? • Integrity of the geological seal • Leakage through wells • Long-term fate, including geochemical reactions
Carbon dioxide properties • Critical point of CO2 is 31oC and 72 atm (7.2 MPa). • CO2 will be injected deep underground at supercritical conditions (depths greater than around 800 m). • CO2 is relatively compressible and its density, although always less than water is typically less than oil. • Low viscosity – typically around10% that of water.
Issues associated with reservoir injection • CO2 can become miscible with the reservoir oil – critical pressure called the MMP (minimum miscibility point). • Wherever the CO2 goes all the oil is recovered – very effective recovery process. • Problem is than CO2 tends to channel along high permeability streaks – low sweep efficiency.
CO2 injection in the North Sea • Ideal opportunity: light oil (reservoir pressures typically above the MMP), mature fields, nearby sources of CO2. • At least 3 billion barrels of extra oil could be recovered in theory. • Known well-characterised geological traps. • Pipeline infrastructure and few, known wells. • UK Government backing of CO2 sequestration in recent energy white paper. • Experience with gas injection in the North Sea (but not CO2!); CO2 injection elsewhere.
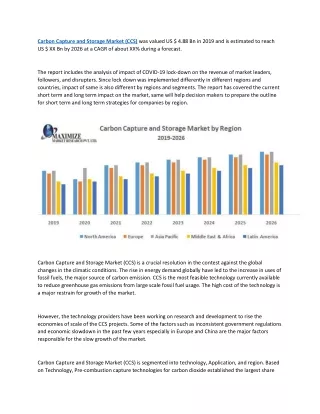
Some numbers • Current emissions are around 25 Gt CO2 per year (6-7 Gt carbon). • Say inject at 10 MPa and 40oC – density is 700 kgm-3. • This is around 108 m3/day or around 650 million barrels per day. Current oil production is around 80 million barrels per day. • Huge volumes – so not likely to be the whole story. • Costs: $6 – 200 per tonne CO2 injected. • 1-3p/KWh for electricity for capture and storage. • Could fill the UK emissions gap in 2020 easily.
What do we do at Imperial? • Work on new technologies. • Lobby Government and engage with oil companies. • My expertise – multiphase flow in porous media and reservoir simulation. • The principal issue affecting CO2 injection is determining where it goes – governed by geology, multiphase flow properties and gravitational forces. • Develop novel simulation methods suitable for the study of such problems.
Overview of the streamline method Permeability field Pressure solve Saturation along SL Saturation for the next time step Initial saturation SL tracing
Saturation update final saturation along a sl Initial saturation Initial saturation along a sl Initial saturation Final saturation Initial saturation (irregular mesh) Final saturation (irregular mesh) Initial saturation (regular mesh) Final saturation (regular mesh)
1D simulations 1D simulation. Inject for 20 years then 180 years of groundwater flow. Advection only. Injection Groundwater flow 20 years 200 years
1D simulations (cont.) 1D simulation. Inject for 20 years then 180 years of groundwater flow. Advection and dissolution. Injection Groundwater flow 20 years 200 years
1D simulations (cont.) 1D simulation. Inject for 20 years then 180 years of groundwater flow. Advection and dissolution and reaction. Injection Groundwater flow 20 years 200 years
3D simulations 1 million cell representation of North Sea Field (SPE 10 case). Permeability field. 4800 m 8800 m 200 m 4800 m 0.0062 K (md) (log) 20000
0 Saturation 0.8 Horizontal slice - advection Simulation of sequestration. CO2 saturation shown. 20 years 4800 m 200 years 4800 m 3970 m 8800 m
Vertical slice - advection Simulation of sequestration. CO2 saturation shown. 20 years 200 m 200 years 200 m 4800 m Saturation 0 0.8
Vertical slice - dissolution Simulation of sequestration. CO2 saturation shown. 20 years 200 m 200 years 200 m 4800 m Saturation 0 0.8
Vertical slice - dissolution Simulation of sequestration. CO2 concentration shown. 20 years 200 m 200 years 200 m 4800 m 2.4 0 Concentration (moles/l)
Vertical slice - reaction Simulation of sequestration. CO2 saturation shown. 20 years 200 m 200 years 200 m 4800 m Saturation 0 0.8
2.4 0 Concentration (moles/l) Vertical slice - reaction Simulation of sequestration. CO2 concentration shown. 20 years 200 m 200 years 200 m 4800 m
0.13 0.15 Porosity Vertical slice - reaction Simulation of sequestration. Porosity shown. 20 years 200 m 200 years 200 m 4800 m
Mass in each phase Study how much mass is in which phase. Sequestration efficiency around 2 – 3 % only. Total mass Solid Freephase Dissolved
Streamline recap • Ideal method for handling initial injection phase – complex thermodynamics and reservoir heterogeneity combined. • Can handle rate-dependent mass transfer – fractures or reaction chemistry. • Readily study large, finely gridded models. • Huge uncertainties in geochemical characterisation.
Overview • Carbon capture and storage is a key component to reduce atmospheric CO2 emissions. • UK has a strategic opportunity to take a lead in CCS. • Unique combination of fossil-fuel burning power stations close to oil fields ripe for CO2 flooding plus pipeline infrastructure. • Main issues to predict where the fluid moves (charactersiation and simulation), monitor where the fluid moves (4D seismic) and long-term fate (geochemistry, dissolution.
Thanks • Lynn Orr (GCEP) and Jon Gibbins (Imperial) for slides and useful insights. • E I Obi (now at Total) the PhD student who did the work. • Shell and BP for (past) financial support.