Download
1 / 1
10 likes | 139 Vues
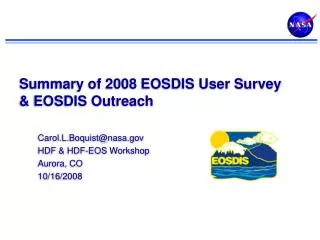
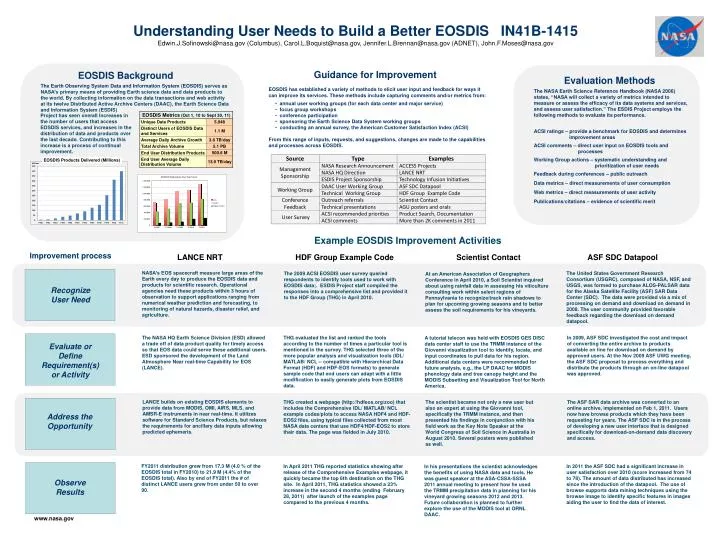
Understanding User Needs to Build a Better EOSDIS IN41B-1415 Edwin.J.Sofinowski@nasa.gov ( Columbus), Carol.L.Boquist@nasa.gov , Jennifer.L.Brennan@nasa.gov ( ADNET), John.F.Moses@nasa.gov. Guidance for Improvement. EOSDIS Background. Evaluation Methods.

E N D
Understanding User Needs to Build a Better EOSDIS IN41B-1415 Edwin.J.Sofinowski@nasa.gov (Columbus), Carol.L.Boquist@nasa.gov, Jennifer.L.Brennan@nasa.gov (ADNET), John.F.Moses@nasa.gov Guidance for Improvement EOSDIS Background Evaluation Methods The Earth Observing System Data and Information System (EOSDIS) serves as NASA’s primary means of providing Earth science data and data products to the world. By collecting information on the data transactions and web activity at its twelve Distributed Active Archive Centers (DAAC), the Earth Science Data and Information System (ESDIS) • EOSDIS has established a variety of methods to elicit user input and feedback for ways it can improve its services. These methods include capturing comments and/or metrics from: • annual user working groups (for each data center and major service) • focus group workshops • conference participation • sponsoring the Earth Science Data System working groups • conducting an annual survey, the American Customer Satisfaction Index (ACSI) • From this range of inputs, requests, and suggestions, changes are made to the capabilities and processes across EOSDIS. The NASA Earth Science Reference Handbook (NASA 2006) states, “NASA will collect a variety of metrics intended to measure or assess the efficacy of its data systems and services, and assess user satisfaction.” The ESDIS Project employs the following methods to evaluate its performance. ACSI ratings – provide a benchmark for EOSDIS and determines improvement areas ACSI comments – direct user input on EOSDIS tools and processes Working Group actions – systematic understanding and prioritization of user needs Feedback during conferences – public outreach Data metrics – direct measurements of user consumption Web metrics – direct measurements of user activity Publications/citations – evidence of scientific merit Project has seen overall increases in the number of users thataccess EOSDIS services, and increases in the distribution of data and products over the last decade. Contributing to this increase is a process of continual improvement. EOSDIS Products Delivered (Millions) Example EOSDIS Improvement Activities Improvement process LANCE NRT HDF Group Example Code Scientist Contact ASF SDC Datapool NASA’s EOS spacecraft measure large areas of the Earth every day to produce the EOSDIS data and products for scientific research. Operational agencies need these products within 3 hours of observation to support applications ranging from numerical weather prediction and forecasting, to monitoring of natural hazards, disaster relief, and agriculture. The United States Government Research Consortium (USGRC), composed of NASA, NSF, and USGS, was formed to purchase ALOS-PALSAR data for the Alaska Satellite Facility (ASF) SAR Data Center (SDC). The data were provided via a mix of processing on demand and download on demand in 2008. The user community provided favorable feedback regarding the download on demand datapool. The 2009 ACSI EOSDIS user survey queried respondents to identify tools used to work with EOSDIS data;. ESDIS Project staff compiled the responses into a comprehensive list and provided it to the HDF Group (THG) in April 2010. At an American Association of Geographers Conference in April 2010, a Soil Scientist inquired about using rainfall data in assessing his viticulture consulting work within select regions of Pennsylvania to recognize/track rain shadows to plan for upcoming growing seasons and to better assess the soil requirements for his vineyards. Recognize User Need The NASA HQ Earth Science Division (ESD) allowed a trade off of data product quality for timely access so that EOS data could serve these additional users. ESD sponsored the development of the Land Atmosphere Near real-time Capability for EOS (LANCE). In 2009, ASF SDC investigated the cost and impact of converting the entire archive to products available on line for download on demand by approved users. At the Nov 2009 ASF UWG meeting, the ASF SDC proposal to process everything and distribute the products through an on-line datapool was approved. THG evaluated the list and ranked the tools according to the number of times a particular tool is mentioned in the survey. THG selected three of the more popular analysis and visualization tools (IDL/ MATLAB/ NCL -- compatible with Hierarchical Data Format (HDF) and HDF-EOS formats) to generate sample code that end users can adapt with a little modification to easily generate plots from EOSDIS data. A tutorial telecon was held with EOSDIS GES DISC data center staff to use the TRMM instance of the Giovanni visualization tool to identify, locate, and input coordinates to pull data for his region. Additional data centers were recommended for future analysis, e.g., the LP DAAC for MODIS phenology data and tree canopy height and the MODIS Subsetting and Visualization Tool for North America. Evaluate or Define Requirement(s) or Activity LANCE builds on existing EOSDIS elements to provide data from MODIS, OMI, AIRS, MLS, and AMSR-E instruments in near real-time. It utilizes software for Standard Science Products, but relaxes the requirements for ancillary data inputs allowing predicted ephemeris. The scientist became not only a new user but also an expert at using the Giovanni tool, specifically the TRMM instance, and then presented his findings in conjunction with his field work as the Key Note Speaker at the World Congress of Soil Science in Australia in August 2010. Several posters were published as well. The ASF SAR data archive was converted to an online archive, implemented on Feb 1, 2011. Users now have browse products which they have been requesting for years. The ASF SDC is in the process of developing a new user interface that is designed specifically for download-on-demand data discovery and access. THG created a webpage (http://hdfeos.org/zoo) that includes the Comprehensive IDL/ MATLAB/ NCL example codes/plots to access NASA HDF4 and HDF-EOS2 files, using typical files collected from most NASA data centers that use HDF4/HDF-EOS2 to store their data. The page was fielded in July 2010. Address the Opportunity FY2011 distribution grew from 17.3 M (4.0 % of the EOSDIS total in FY2010) to 21.9 M (4.4% of the EOSDIS total). Also by end of FY2011 the # of distinct LANCE users grew from under 50 to over 90. In 2011 the ASF SDC had a significant increase in user satisfaction over 2010 (score increased from 74 to 78). The amount of data distributed has increased since the introduction of the datapool. The use of browse supports data mining techniques using the browse image to identify specific features in images aiding the user to find the data of interest. In April 2011 THG reported statistics showing after release of the Comprehensive Examples webpage, it quickly became the top 6th destination on the THG site. In April 2011, THG statistics showed a 23% increase in the second 4 months (ending February 28, 2011) after launch of the examples page compared to the previous 4 months. In his presentations the scientist acknowledges the benefits of using NASA data and tools. He was guest speaker at the ASA-CSSA-SSSA 2011 annual meeting to present how he used the TRMM precipitation data in planning for his vineyard growing seasons 2012 and 2013. Future collaboration is planned to further explore the use of the MODIS tool at ORNL DAAC. Observe Results