Download
1 / 1
10 likes | 98 Vues
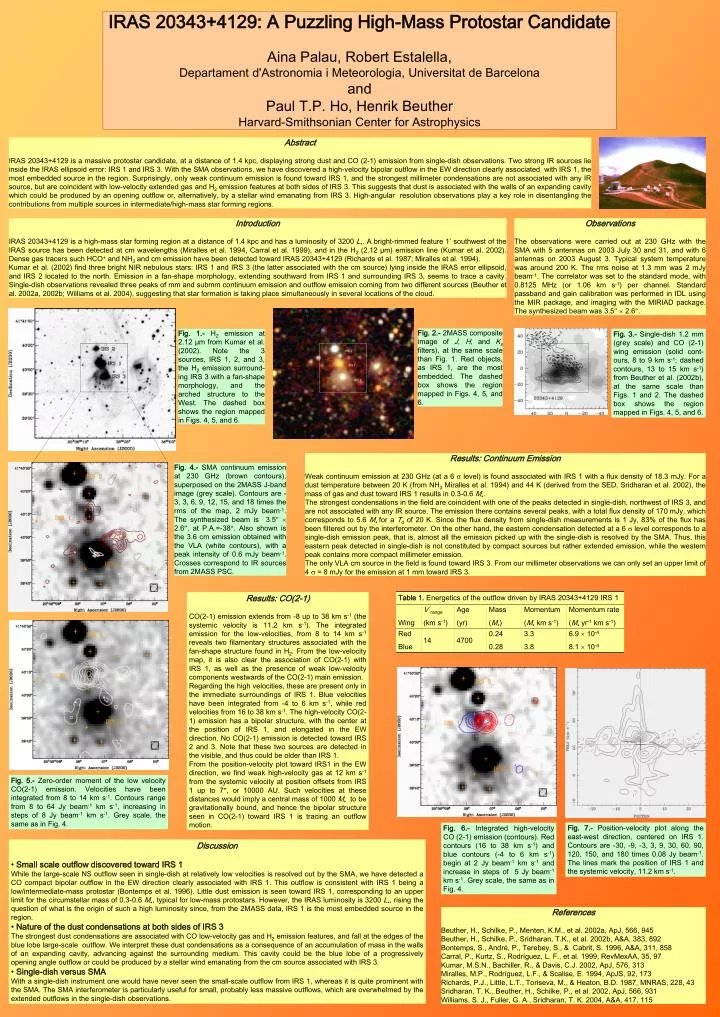
IRAS 20343+4129: A Puzzling High-Mass Protostar Candidate Aina Palau, Robert Estalella, Departament d'Astronomia i Meteorologia, Universitat de Barcelona and Paul T.P. Ho, Henrik Beuther Harvard-Smithsonian Center for Astrophysics. Abstract

E N D
IRAS 20343+4129: A Puzzling High-Mass Protostar Candidate Aina Palau, Robert Estalella, Departament d'Astronomia i Meteorologia, Universitat de Barcelona and Paul T.P. Ho, Henrik Beuther Harvard-Smithsonian Center for Astrophysics Abstract IRAS 20343+4129 is a massive protostar candidate, at a distance of 1.4 kpc, displaying strong dust and CO (2-1) emission from single-dish observations. Two strong IR sources lie inside the IRAS ellipsoid error: IRS 1 and IRS 3. With the SMA observations, we have discovered a high-velocity bipolar outflow in the EW direction clearly associated with IRS 1, the most embedded source in the region. Surprisingly, only weak continuum emission is found toward IRS 1, and the strongest millimeter condensations are not associated with any IR source, but are coincident with low-velocity extended gas and H2 emission features at both sides of IRS 3. This suggests that dust is associated with the walls of an expanding cavity which could be produced by an opening outflow or, alternatively, by a stellar wind emanating from IRS 3. High-angular resolution observations play a key role in disentangling the contributions from multiple sources in intermediate/high-mass star forming regions. Introduction IRAS 20343+4129 is a high-mass star forming region at a distance of 1.4 kpc and has a luminosity of 3200 L. A bright-rimmed feature 1′ southwest of the IRAS source has been detected at cm wavelengths (Miralles et al. 1994, Carral et al. 1999), and in the H2 (2.12 μm) emission line (Kumar et al. 2002). Dense gas tracers such HCO+ and NH3 and cm emission have been detected toward IRAS 20343+4129 (Richards et al. 1987; Miralles et al. 1994). Kumar et al. (2002) find three bright NIR nebulous stars: IRS 1 and IRS 3 (the latter associated with the cm source) lying inside the IRAS error ellipsoid, and IRS 2 located to the north. Emission in a fan-shape morphology, extending southward from IRS 1 and surrounding IRS 3, seems to trace a cavity. Single-dish observations revealed three peaks of mm and submm continuum emission and outflow emission coming from two different sources (Beuther et al. 2002a, 2002b; Williams et al. 2004), suggesting that star formation is taking place simultaneously in several locations of the cloud. Observations The observations were carried out at 230 GHz with the SMA with 5 antennas on 2003 July 30 and 31, and with 6 antennas on 2003 August 3. Typical system temperature was around 200 K. The rms noise at 1.3 mm was 2 mJy beam-1. The correlator was set to the standard mode, with 0.8125 MHz (or 1.06 km s-1) per channel. Standard passband and gain calibration was performed in IDL using the MIR package, and imaging with the MIRIAD package. The synthesized beam was 3.5 2.6. Fig. 2.- 2MASS composite image of J, H, and Ks filters), at the same scale than Fig. 1. Red objects, as IRS 1, are the most embedded. The dashed box shows the region mapped in Figs. 4, 5, and 6. Fig. 3.- Single-dish 1.2 mm (grey scale) and CO (2-1) wing emission (solid cont-ours, 8 to 9 km s-1; dashed contours, 13 to 15 km s-1) from Beuther et al. (2002b), at the same scale than Figs. 1 and 2. The dashed box shows the region mapped in Figs. 4, 5, and 6. Fig. 1.- H2 emission at 2.12 μm from Kumar et al. (2002). Note the 3 sources, IRS 1, 2, and 3, the H2 emission surround-ing IRS 3 with a fan-shape morphology, and the arched structure to the West. The dashed box shows the region mapped in Figs. 4, 5, and 6. Results: Continuum Emission Weak continuum emission at 230 GHz (at a 6 level) is found associated with IRS 1 with a flux density of 18.3 mJy. For a dust temperature between 20 K (from NH3 Miralles et al. 1994) and 44 K (derived from the SED, Sridharan et al. 2002), the mass of gas and dust toward IRS 1 results in 0.3-0.6 M. The strongest condensations in the field are coincident with one of the peaks detected in single-dish, northwest of IRS 3, and are not associated with any IR source. The emission there contains several peaks, with a total flux density of 170 mJy, which corresponds to 5.6 Mfor a Td of 20 K. Since the flux density from single-dish measurements is 1 Jy, 83% of the flux has been filtered out by the interferometer. On the other hand, the eastern condensation detected at a 6 level corresponds to a single-dish emission peak, that is, almost all the emission picked up with the single-dish is resolved by the SMA. Thus, this eastern peak detected in single-dish is not constituted by compact sources but rather extended emission, while the western peak contains more compact millimeter emission. The only VLA cm source in the field is found toward IRS 3. From our millimeter observations we can only set an upper limit of 4 = 8 mJy for the emission at 1 mm toward IRS 3. Fig. 4.- SMA continuum emission at 230 GHz (brown contours), superposed on the2MASS J-band image (grey scale). Contours are -3, 3, 6, 9, 12, 15, and 18 times the rms of the map, 2 mJy beam-1. The synthesized beam is 3.5 2.6, at P.A.=-38. Also shown is the 3.6 cm emission obtained with the VLA (white contours), with a peak intensity of 0.6 mJy beam-1. Crosses correspond to IR sources from 2MASS PSC. Results: CO(2-1) CO(2-1) emission extends from -8 up to 38 km s-1 (the systemic velocity is 11.2 km s-1). The integrated emission for the low-velocities, from 8 to 14 km s-1 reveals two filamentary structures associated with the fan-shape structure found in H2. From the low-velocity map, it is also clear the association of CO(2-1) with IRS 1, as well as the presence of weak low-velocity components westwards of the CO(2-1) main emission. Regarding the high velocities, these are present only in the immediate surroundings of IRS 1. Blue velocities have been integrated from -4 to 6 km s-1, while red velocities from 16 to 38 km s-1. The high-velocity CO(2-1) emission has a bipolar structure, with the center at the position of IRS 1, and elongated in the EW direction. No CO(2-1) emission is detected toward IRS 2 and 3. Note that these two sources are detected in the visible, and thus could be older than IRS 1. From the position-velocity plot toward IRS1 in the EW direction, we find weak high-velocity gas at 12 km s-1 from the systemic velocity at position offsets from IRS 1 up to 7, or 10000 AU. Such velocities at these distances would imply a central mass of 1000 M to be gravitationally bound, and hence the bipolar structure seen in CO(2-1) toward IRS 1 is tracing an outflow motion. Fig. 5.- Zero-order moment of the low velocity CO(2-1) emission. Velocities have been integrated from 8 to 14 km s-1. Contours range from 8 to 64 Jy beam-1 km s-1, increasing in steps of 8 Jy beam-1 km s-1. Grey scale, the same as in Fig. 4. Fig. 7.- Position-velocity plot along the east-west direction, centered on IRS 1. Contours are -30, -9, -3, 3, 9, 30, 60, 90, 120, 150, and 180 times 0.08 Jy beam-1. The lines mark the position of IRS 1 and the systemic velocity, 11.2 km s-1. Fig. 6.- Integrated high-velocity CO (2-1) emission (contours). Red contours (16 to 38 km s-1) and blue contours (-4 to 6 km s-1) begin at 2 Jy beam-1 km s-1 and increase in steps of 5 Jy beam-1 km s-1. Grey scale, the same as in Fig. 4. • Discussion • Small scale outflow discovered toward IRS 1 • While the large-scale NS outflow seen in single-dish at relatively low velocities is resolved out by the SMA, we have detected a CO compact bipolar outflow in the EW direction clearly associated with IRS 1. This outflow is consistent with IRS 1 being a low/intermediate-mass protostar (Bontemps et al. 1996). Little dust emission is seen toward IRS 1, corresponding to an upper limit for the circumstellar mass of 0.3-0.6 M, typical for low-mass protostars. However, the IRAS luminosity is 3200 L, rising the question of what is the origin of such a high luminosity since, from the 2MASS data, IRS 1 is the most embedded source in the region. • Nature of the dust condensations at both sides of IRS 3 • The strongest dust condensations are associated with CO low-velocity gas and H2 emission features, and fall at the edges of the blue lobe large-scale outflow. We interpret these dust condensations as a consequence of an accumulation of mass in the walls of an expanding cavity, advancing against the surrounding medium. This cavity could be the blue lobe of a progressively opening angle outflow or could be produced by a stellar wind emanating from the cm source associated with IRS 3. • Single-dish versus SMA • With a single-dish instrument one would have never seen the small-scale outflow from IRS 1, whereas it is quite prominent with the SMA. The SMA interferometer is particularly useful for small, probably less massive outflows, which are overwhelmed by the extended outflows in the single-dish observations. References Beuther, H., Schilke, P., Menten, K.M., et al. 2002a, ApJ, 566, 945 Beuther, H., Schilke, P., Sridharan, T.K., et al. 2002b, A&A, 383, 892 Bontemps, S., André, P., Terebey, S., & Cabrit, S. 1996, A&A, 311, 858 Carral, P., Kurtz, S., Rodríguez, L. F., et al. 1999, RevMexAA, 35, 97 Kumar, M.S.N., Bachiller, R., & Davis, C.J. 2002, ApJ, 576, 313 Miralles, M.P., Rodríguez, L.F., & Scalise, E. 1994, ApJS, 92, 173 Richards, P.J., Little, L.T., Toriseva, M., & Heaton, B.D. 1987, MNRAS, 228, 43 Sridharan, T. K., Beuther, H., Schilke, P., et al. 2002, ApJ, 566, 931 Williams, S. J., Fuller, G. A., Sridharan, T. K. 2004, A&A, 417, 115