Download
1 / 28
280 likes | 421 Vues
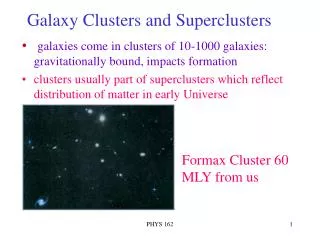
Planck and Superclusters. Tartu observatory Tuorla observatory. Total mass-energy density of the Universe: Dark energy (73%) Dark matter(23%) Baryons(4%).

E N D
Planck and Superclusters Tartu observatory Tuorla observatory
Total mass-energy density of the Universe: • Dark energy (73%) • Dark matter(23%) • Baryons(4%)
At z>2 all baryons are found in the Lya forest, but about 45% of the baryons z<2 are missing (infered from stars,atomic and molecular gas, dust, plasma in clusters) Distribution of baryons in the local Universe is one of the open questions in cosmology. Nicastro et al. 2008, Science
Theoretical and numerical work has been predicted most of these ‘missing baryons’ should be in a plasma with temperatures 105 and 107 K in filaments connecting the clusters (in regions with moderate overdensities) (Cen&Ostriker 1999, 2006) • - WHIM (Warm-Hot Intergalactic Medium) - An important contribution to the diffuce emission and WHIM is expected to reside in superclusters (SC). Croft et al. 2001
Detection of WHIM is challenging Different methods: -Soft X-ray emission -Absorption lines in X-ray and UV quasar spectra -Thermal Sunyaev- Zeldovich effect on CMB photons
PLANCK WG5: Clusters and secondary anisotropies -SZ cluster cataloque -Multi-wavelength cluster science -Gravitational lensing -Reionisation -ISW recovery -Large-scale structure the intensity change of the CMBR caused by the SZ-effect is proportional to the comptonization parameter y
Refregier and Teyssier 2002 • Galaxy clusters y~10-4 • Small groups, faint protoclusters y~5*10-6 • Total <y>~1.2* 10-6 • <y>WHIM~7*10-7 60% of the total value of the y-parameter is originated by WHIM gas (half of that closer than z<1). Hernandez-Monteagudo et al. 2006: About 80% of tSZ is generated in collapsed structures, ~15% in SC and filaments Roncarelli et al. 2007 simulations
Studies of diffuse and kinetic SZ signals Objectives (some of them):_ • Analysis of the residual y-map after cluster extraction: large-scale filamentary structure of the WHIM individual superclusters
Our contribution • To produse supercluster maps from the observations and simulations using luminosity-density method: 2dF, SDSS, 2MASS, UKIDSS.
Done before… • Einasto et al. 2003, A&A, 405, 425 • Einasto et al. 2007, A&A, 462, 811 • Tago et al. 2006, AN, 327, 365 • Tago et al. 2007 submitted
1. Catalogue As a basis, a SDSS DR5 catalogue of groups and isolated galaxies (Tago et al. 2007) for the survey region was used. 5740 sq.deg about 14% of the sky z=0.009 – 0.12 Such a catalogue includes all survey galaxies, but positions group and cluster galaxies at the mean group— cluster distance, suppressing the redshift space fingers. SDSS DR6: 7425 sq.deg. 2dF: about 2000 sq.deg. 2MASS: all sky, near infrared PSCz (Iras)
2. Luminosities Calculation of the expected total luminosities of galaxies. We assume that every galaxy is a visible member of a density enhancement (group or cluster). This allows to correct the galaxy luminosities for the observational magnitude limited samples by a weighting factor that takes into account the luminosities of galaxies outside of the visibility window: Ltot=LobsWL Lobs is the luminosity of an observed galaxy WL is the ratio of the expected total luminosity to the expected luminosity in the visibility window L Є[L1,L2] at the distance of the group LF by Norberg et al. (2002) for the 2dFGRS and Blanton et al. (2003) for the SDSS.
This procedure yields a total mean luminosity density that is approximately independent of the distance from the observer. There are also several caveats; e.g., the narrow magnitude window of the SDSS leads to very high correction factors; using these would make the density correction-dominated. Recently we have used the rule: if (WL>3) then WL=3. This, however, limits the region where the estimated density is unbiased, approximately by 100<D<300 ,(Mpc/h).
3. Density grid • A Cartesian grid with a step of 1h-1 Mpc (the characteristic size of compact galaxy systems -- groups and clusters) is defined within and around the survey volume (grid size optional)
4. Luminosity density maps • The luminosity density field is calculated, using the 3 dimensional B3 kernel of the radius (1-16 Mpc/h), centred on the galaxies -- groups. For superclusters 8-16 Mpc/h.
“All-sky” map in the Healpix format. Luminosity density distribution separated by distance layers (example 200-300 Mpc)
400-500 Mpc 300-400 Mpc 200-300 Mpc 100-200 Mpc 0-100 Mpc
5. Superclusters • In order to delimit supercluster, a threshold luminosity density D0 (in units of mean luminosity density), and a minimal supercluster volume V0 were chosen. D0=4.6, V0=200 Mpc3/h3 (Einasto et al. 2007 A&A 462, 811, A&A 462, 397)
6. Supercluster maps The total supercluster luminosity Ltot was found by summing over all the grid vertices within supercluster boundaries. For every supercluster, the galaxies and groups inside the supercluster boundaries were selected - cluster data, optical, x-ray, radio…
Individual supercluster maps in the FITS binary table extension format Tables contains: name, ra, dec, mean distance,total luminosity/mass estimation, size, reference for known x-ray clusters, sky map …