Download
1 / 21
210 likes | 222 Vues
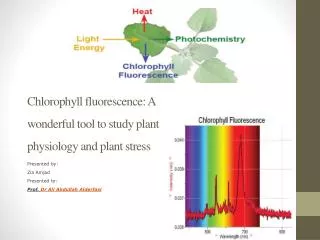
Biological Sciences Department. P lant S tress P hysiology ( PSP ). Plant sensing and responding to stress. Dr. Khalid Alsharafa. • Introduction. High light. Light / Dark. Pathogens. Temperature. Herbivorous. Folding. Drought. Heavy metals. Salinity. ROS.

E N D
Biological Sciences Department Plant Stress Physiology (PSP) Plant sensing and responding to stress Dr. Khalid Alsharafa
• Introduction High light Light / Dark Pathogens Temperature Herbivorous Folding Drought Heavy metals Salinity ROS ROS; reactive oxygen species
• Enzymatic / non enzymatic routes Gadjev et al. (2008)
• Scavenging of ROS in plants Development Developmental signals strategies PCD ROS Abiotic stress Stress acclimation Biotic stress Lower the rate of ROS production suppressing ROS-producing reactions different stress avoidance strategies Scavenge of ROS anti-oxidants (Carotenoids, Tocopherols, Glutathione, Ascorbate, Flavonoids) anti-oxidative enzymes (SOD, AsA-GSH cycle, Catalase, Peroxiredoxins, GPX, Apx) Mittler (2002), Mittleret al. (2004)
2CPA DHAR NAD(P)H PrxIIE sSOD PrxQ sAPX MDHAR GR PrxQ tAPX NAD(P)H tSOD NADP+ Fd Water-water cycle O2.- H2O NAD(P)+ H2O NAD(P)H e- H2O2 H2O GSH GSSG NAD(P)+ Mehler reaction Ascorbate MDHA O2 PSII PSI DHA O2 H2O Modified after Dietz, 2007
Genome Genomics Genotype X Environment Transcriptome Transcriptomics Translatomics Translatome Analysis 2D Gels + MS LC-MSMSn Proteome Proteomics NMR, LC-MS Metabolome Metabolomics Microarrays
Abiotic stress, severity, Duration (min’s……..) Stimulus Chl LHCB PSII PQH2 cytb6/f PSI Kinases, phosphoralses Heat ATP NADPH 1O*2 O-2 NPQ Transition state Sensing H2O2 Signals JA Thr GSH ?? EX Post-transcription Translation Transcription AAAAAAAAA TFs Responding Gene regulation AAAAAAAAA AAAAAAAAA AAAAAAAAA 5´ UTR 3´ UTR AAAAAAAAA AAAAAAAAA AAAAAAAAA CPE AAAAAAAA 3´ AAUAAA 5´ m7G uORF Retrograde Signals Ribosome TFs Nucleus Candidate genes Microarray DNA Protein modification metabolism ?? photosynthesis Transport + = _ AAAAAAAAA Transcription Stress response miRNA Regulation Mechanism StabilitySlicing Translation Steady state Nucleo run on Coding region
• Aims of the my talk - Monitoring plants acclimation response for biotic and different exposure timesof different abiotic stresses - Detection of different retrograde signalling in response to abiotic stresses - Analysis of post-transcriptional regulation at the level of enzyme activity in response to abiotic stress dose and exposure duration
Three weeks under NL Ten days under LL Ten days under NL HL exposure (0min, 10min, 30min, 60min, 180min, 360min) • Results - Light shift processes NL; Normal Light LL ; Low Light HL; High Light (~80 µmol photons* m-2* s-1) (~8 µmol photons* m-2* s-1) (~80 µmol photons* m-2* s-1) (~800 µmol photons* m-2* s-1) Morphogenicdifferences such as elongated petioles, small leaves and curling leaves
- Mineral deficiency leaves tip burn
- Biotic stress Table Soil electric conductivity (EC) and pH; Data were represent means ± SD, n=3. Soil character EC (μS/cm) pH Soil depth 20cm 368±1.4 8.1±0.14 40cm 311.33±2.6 8.053±0.0094 60cm 420±0.47 8.03±0.008 leaf tip burn Al-sharafa and Al-limoun(2015)
Chlorophyll content under different mineral deficiencies Figure: Chlorophyll a and b contents in L. esculentum Mill. leaves in response to specific mineral deficiencies in comparison to complete nutrients solution grown plants at time dependent exposure (A) 48h, (B) 72h and (C) 96h (*P≤ 0.05). no indications of chlorophyll breakdown Al-sharafa(2017)
Detection of different retrograde signalling Reactive oxygen species detection Hydrogen peroxide production Elevation depend on the specific mineral deficiency Al-sharafa(2017) means ± S.D; n= 4-9, *p<0.05
Lipid peroxidation level Production level in parallel with H2O2 level Al-sharafa(2017) means ± S.D; n= 4-9, *p<0.05
Quantification of antioxidants Anthocyanin content Production level in parallel with H2O2 level Al-sharafa(2017) means ± S.D; n=3, *p<0.05,
Carotenoids content Production level in parallel with H2O2 level Al-sharafa(2017) means ± S.D; n=3, *p<0.05,
Total phenolic compounds content Production level in parallel with H2O2 level Al-sharafa(2017) means ± S.D; n=3, *p<0.05,
• Conclusions The involvement of sophisticated and tightly regulated stress-sensing mechanisms, efficient signal transduction pathways, efflux or compartmentation of toxic ion systems and key detoxification strategies, illustrate how fascinating is the story of plant ion homeostasis under environmental stress.
• References • Alsharafa K, Vogel MO, Oelze M-L, Moore M, Stingl N, König K, Friedman H, Mueller MJ, Dietz K-J. 2014 Kinetics of retrograde signalling initiation in the high light response of Arabidopsis thaliana. Phil. Trans. R. Soc. B 369: 20130424. • AlsharafaKY. 2017. Mineral deficiencies influence on tomato leaves: pigments, hydrogen peroxide and total phenolic compounds contents. Plant Omics. • AlsharafaKY. 2017. Mineral deficiencies effect on resistance-related enzymes activities in tomato leaves. In press.