1 / 0

Outline for Today

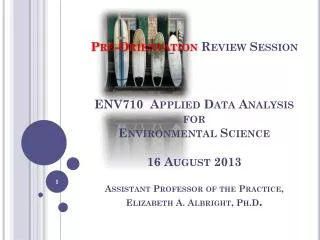
Pre-Orientation Review Session ENV710 Applied Data Analysis for Environmental Science 16 August 2013 Assistant Professor of the Practice, Elizabeth A. Albright, Ph.D . Outline for Today. Introductions Overview of diagnostic exam Scroll through the Stats Review Website

chaka
Télécharger la présentation

Outline for Today

An Image/Link below is provided (as is) to download presentation Download Policy: Content on the Website is provided to you AS IS for your information and personal use and may not be sold / licensed / shared on other websites without getting consent from its author. Content is provided to you AS IS for your information and personal use only. Download presentation by click this link. While downloading, if for some reason you are not able to download a presentation, the publisher may have deleted the file from their server. During download, if you can't get a presentation, the file might be deleted by the publisher.

E N D

Presentation Transcript


  1. Pre-Orientation Review SessionENV710 Applied Data Analysis for Environmental Science16 August 2013Assistant Professor of the Practice, Elizabeth A. Albright, Ph.D.
  2. Outline for Today Introductions Overview of diagnostic exam Scroll through the Stats Review Website Review/Practice Problems Basic math Descriptive statistics Probability Sampling Inference Confidence intervals Comparisons of Means
  3. Tool Set Computational math Algebra Probability theory Logic/Reasoning Research/Experimental design Statistical software coding Communication skills (written and oral) Greek alphabet/notation
  4. Overview of Diagnostic 22 questions One hour and 15 minutes Multiple choice, True/False, Calculations No calculators No credit for work w/o correct answer Distribution table(s) will be supplied
  5. Potential Topics Basic math Descriptive statistics Probability Sampling Inference Confidence intervals Comparison of means
  6. The Statistics Review Website http://sites.nicholas.duke.edu/statsreview
  7. Basic Math Rounding/Significant digits Algebra Exponents and their rules Logarithms and their rules
  8. Basic Math Practice Problems
  9. Descriptive Statistics Measure of central tendency Mean Median Mode Measure of spread Standard deviation Variance IQR Range Skewness Outliers
  10. Question of Interest Do Nicholas or Fuqua faculty members have larger transportation carbon footprints?
  11. The Steps Design the study Random sampling Collect the data Describe the data Infer from the sample to the population
  12. CO2 Emissions (metric tons) from Transportation Sources for 10 Randomly Selected NSOE Faculty
  13. Probability
  14. Random Variable A variable whose value is a function of a random process Discrete Continuous If X is a random variable, then p(X=x) is the probability that the the value x will occur
  15. Which of the following is a discrete random variable? The height of a randomly selected MEM student. The annual number of lottery winners from Durham. The number of presidential elections in the United States in the 20th century. (A) I only 
(B) II only 
(C) III only 
 (D) I and II 
(E) II and III
  16. Properties of Probability The events A and B are mutually exclusive if they have no outcomes in common and so can never occur together. If A and B are mutually exclusive then P(A or B) = P(A) + P(B) Example: Roll a die. What’s the probability of getting a 1 or a 2?
  17. P(A or B) What if events A and B are not mutually exclusive? P(A or B) = P(A) + P(B) – P(A and B)
  18. Deck of Cards
  19. P(A or B) Example: What’s the probability of pulling a red card or a queen from a deck of cards?
  20. P(A and B) p(A and B) = p(A) * p(B) Two consecutive flips of a coin, A and B A = [heads on first flip] B = [heads on second flip] p(A and B) = ??? p(A and B) = ½ * ½ = 1/4
  21. The Normal Distribution
  22. The Normal Distribution Normal Distribution (2012) Last accessed September, 2012 from http://www.comfsm.fm/~dleeling/statistics/notes06.html.
  23. Z Score How do you convert any normal curve to the standard normal curve?
  24. Normal Distribution Calculations If X is normally distributed around a mean of 32 and a standard deviation of 8, find: p(X>32) p(X>48) p(X<24) p(40<X<48)
  25. Normal Distribution Practice Problem The crop yield is typically measured as the amount of the crop produced per acre. For example, cotton is measured in pounds per acre. It has been demonstrated that the normal distribution can be used to characterize crop yields over time. Historical data suggest that the probability distribution of next summer’s cotton yield for a particular North Carolina farm can be characterized by a normal distribution with mean 1,500 pounds per acres and standard deviation 250. The farm in question will be profitable if it produces at least 1,600 pounds per acre. What is the probability that the farm will lose money next summer?
  26. Sampling andthe Central Limit theorem
  27. Sampling Why do we sample? In simple random sampling every unit in the population has an equal probability of being sampled. Sampling error Samples will vary because of the random process
  28. Central Limit Theorem As the size of a sampling distribution increases, the sampling distribution of Xbar concentrates more and more around µ. The shape of the distribution also gets closer and closer to normal. population n=5 n=100
  29. Profundity of Central Limit Theorem As sample size gets larger, even if you start with a non-normal distribution, the sampling distribution approaches a normal distribution
  30. Sampling Distribution of the Sample Means Mean of the sample means Standard Error Standard deviation of the sampling distribution of sample means
  31. SE vs. SD What is the difference between standard deviation and standard error? SD is the typical deviation from the average; it doesn’t depend on random sampling. SE is the typical deviation from the expected value in a random sample. SE results from random sampling.
  32. Practice Problem The gypsy moth is a serious threat to oak and aspen trees A state agriculture department places traps throughout the state to detect the moths. When traps are checked periodically, the mean number of moths trapped in each trap is only 0.5, but some traps have several moths. The distribution of moth counts is discrete and strongly skewed with a standard deviation of 0.7. What is the standard deviation of the mean number of moths in 50 traps? What’s the probability that the average number of moths of 50 traps is greater than 0.6?
  33. Inference….
  34. Inference We infer from a sample to a population. Need to take into account sampling error. Confidence intervals Comparison of means tests
  35. Confidence Interval with KNOWN standard deviation Let’s construct a 95% confidence interval (Xbar-1.96*SE < µ < Xbar+ 1.96*SE) Where did I get the 1.96 (the multiplier)? Very important!!! It is the confidence interval that varies, not the population mean.
  36. CI Practice Problem We want to construct a 95% confidence interval around the mean number of hours that Nicholas MEM students (who are enrolled in statistics) spend studying statistics each week. We randomly sample 36 students and find that the average study time is eight hours. The standard deviation of study time of the population of all students in statistics is 2 hours. Calculate the 95% confidence interval of the mean study time. How do you interpret the confidence interval?
  37. Confidence interval Interpretation Based on a random sample of 100 trees in a plot in Duke Forest, a 90% confidence interval for the mean diameter at breast height (DBH) was calculated (29.5 cm, 32.5 cm). Which of the following is true? (a) 90% of all trees in this plot of Duke Forest have DBH values between 29.5 and 32.5 cm. (b) We are 90% confident that the interval (29.5 cm, 32.5 cm) captures the true mean DBH of all trees in this plot of Duke Forest. (c) We are 90% confident that a randomly selected tree will have a DBH between 29.5 and 32.5 cm. (d) The mean DBH of the trees in the Duke Forest plot is 31.0 cm 90% of the time. (e) 90% of all samples of trees within the plot of Duke Forest will have mean DBH measurements between 29.5 and 32.5 cm.
  38. Comparison of Means Tests One sample Is the average dissolved oxygen concentration less than 5mg/L? Two independent samples Do residents of North Carolina spend more on organic food than residents of South Carolina? Matched/Pairs/Repeated samples Are individuals’ left hands larger than their right hands?
  39. One-Sample Hypothesis Testing Approach Set up a ‘null hypothesis’ , (typically hypothesizing there is no difference between the population mean and a given value) Establish an alternative hypothesis (that there is a difference between the population mean and a given value) Calculate sample mean, standard deviation, standard error Calculate a the test statistic and a p-value The smaller the p-value, the more statistically significant results Interpret results
  40. Test Statistic z vs. t test statistic Z: known population standard deviation or large sample size t: used when estimating standard deviation of population with the standard deviation of the sample
  41. P-Values P-value = the probability of getting the sample statistic as least as large as what was observed, assuming that the null hypothesis is true. The smaller the p-value, the more evidence there is AGAINST the null hypothesis.
  42. Are these new light bulbs better? A standard manufacturing process has produced millions of light bulbs, with a mean life of 1200 hours. A new process, recommended by the USEPA, produces a sample of 25 bulbs, with an average of 1265 hours (standard deviation of the population of light bulbs is 300 hours). Although this sample makes the new process look better, is this just a sampling fluke? Is it possible that the new process is really no better than the old?
  43. QUESTIONS?
More Related