Download
1 / 18
180 likes | 353 Vues
Report Card Scoring. Several options under consideration for scoring and aggregating data. Why turn data into indices?. Integrate multiple measures into thematic scores Evaluate overall trends and compare locations Simplify communication with decision makers and the public. Four Main Steps.

E N D
Report Card Scoring Several options under consideration for scoring and aggregating data
Why turn data into indices? • Integrate multiple measures into thematic scores • Evaluate overall trends and compare locations • Simplify communication with decision makers and the public
Four Main Steps • Select and group indicators • Transform measured data into unit-less scores • Aggregate scores from multiple indicators into a summary index • Define breakpoints to bin index scores into descriptors of condition (grades or colors)
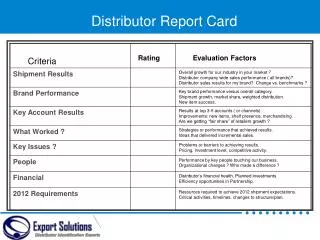
Central Coast RegionPreliminary Indices • Human Health WQ Index • Aquatic Life WQ Index • Toxicity Index • Bioassessment Index • Biostimulatory Risk Index • Habitat Index • Riparian Index
Indicators within Indices Example from the Central Coast Region 1. Human Health Water Quality Index Fecal Coliform E. coli Pathogens Nitrate Toxic chemicals
Indicators within Indices Example from the Central Coast Region 2. Aquatic Life Water Quality Index Ammonia Nitrate Ortho-phosphate DO departure Toxic chemicals Turbidity Total dissolve solids Total susp. sediment pH departure
Scoring Approach 1 Scoring into categories using multiple thresholds If the mean > 20 then the color = Dark Red If the mean > 10 and the mean <= 20 then the color = Red If the mean > 5 and the mean <= 10 then the color = Orange If the mean <= 5 then the color = Yellow If the mean <= 1 and the max < 5 then the color = Green If the mean <= 0.3 and the max < 1 then the color = Blue This is the approach used on the CCAMP website
Scoring Approach 2 Quotient Method Divide measurement by a standard Pro: + scientific consensus behind standards + capture magnitude of excursion Con: - no fixed upper end to scale - appropriate standards must be available
Scoring Approach 3 Magnitude and Exceedance Quotient (MEQ) Combines two terms that express number of threshold exceedances and magnitude of exceendance. Derived from Canadian Ministry of Governments method
Canadian CCME WQ Index Factor 1: Scope Factor 2: Frequency Factor 3: Amplitude
Canadian CCME WQ Index, cont. CCME WQ Index Quadratic mean (or root mean square) gives greater weight to larger values, thus emphasizing excursions.
Canadian CCME WQ Index, cont. Pro: + widely excepted (esp. for drinking water) + considers scope, frequency, amplitude Con: - resolution to detect differences among sites or times depends heavily on standards selected - Not as useful for characterizing “healthy” because it only looks at failed tests - Scope is susceptible to site variability in number of analytes tested (best for very consistent study design)
MEQ: modifications to CCME We are scoring all tests, not just failed tests. This provides a “good” end to the scoring tool We eliminated the scope term (how many analytes fail) because we have inconsistent data availability across sites. We do the calculations at the level of the analyte so that each analyte can also be scored
Calculating MEQ Calculate rate of exceedance (frequency) for each individual analyte (from CCME) Factor 1: Frequency F1 F1
Calculating MEQ, cont. Calculate magnitude (amplitude) for each individual analyte (from CCME) Calculate unitless sample magnitudes: Magnitude = concentration/threshold Calculate normalized sum of magnitudes NSM = Σ magnitudes / sample count Scale from 0 – 100 = NSM / (0.01*magnitude average+0.01)
Calculating MEQ, cont. Combine exceedanceand magnitude factors and scale to 100 (modified from CCME) MEQ = 100 – √exceedance2 + magnitude2 1.414
Aggregate scores into an index • Number of standard excursions per site • Means: arithmetic, geometric, harmonic, quadratic • Worst case • Weights and penalty factors • Regression of simple to comprehensive indices • Empirical formulae