Download
1 / 1
10 likes | 188 Vues
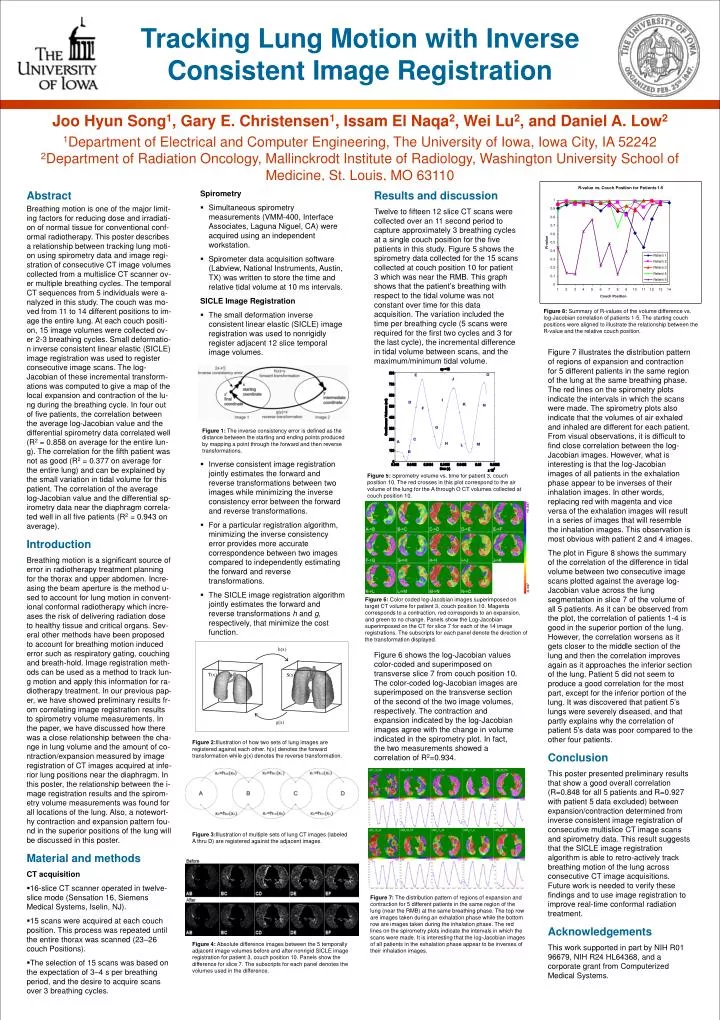
O. E. J. I. D. K. N. F. G. C. A. H. M. L. B. Tracking Lung Motion with Inverse Consistent Image Registration. Joo Hyun Song 1 , Gary E. Christensen 1 , Issam El Naqa 2 , Wei Lu 2 , and Daniel A. Low 2

E N D
O E J I D K N F G C A H M L B Tracking Lung Motion with Inverse Consistent Image Registration Joo Hyun Song1, Gary E. Christensen1, Issam El Naqa2, Wei Lu2, and Daniel A. Low2 1Department of Electrical and Computer Engineering, The University of Iowa, Iowa City, IA 522422Department of Radiation Oncology, Mallinckrodt Institute of Radiology, Washington University School of Medicine, St. Louis, MO 63110 • Spirometry • Simultaneous spirometry measurements (VMM-400, Interface Associates, Laguna Niguel, CA) were acquired using an independent workstation. • Spirometer data acquisition software (Labview, National Instruments, Austin, TX) was written to store the time and relative tidal volume at 10 ms intervals. SICLE Image Registration • The small deformation inverse consistent linear elastic (SICLE) image registration was used to nonrigidly register adjacent 12 slice temporal image volumes. • Inverse consistent image registration jointly estimates the forward and reverse transformations between two images while minimizing the inverse consistency error between the forward and reverse transformations. • For a particular registration algorithm, minimizing the inverse consistency error provides more accurate correspondence between two images compared to independently estimating the forward and reverse transformations. • The SICLE image registration algorithm jointly estimates the forward and reverse transformationshand g, respectively, that minimize the cost function. Results and discussion Twelve to fifteen 12 slice CT scans were collected over an 11 second period to capture approximately 3 breathing cycles at a single couch position for the five patients in this study. Figure 5 shows the spirometry data collected for the 15 scans collected at couch position 10 for patient 3 which was near the RMB. This graph shows that the patient’s breathing with respect to the tidal volume was not constant over time for this data acquisition. The variation included the time per breathing cycle (5 scans were required for the first two cycles and 3 for the last cycle), the incremental difference in tidal volume between scans, and the maximum/minimum tidal volume. Figure 6 shows the log-Jacobian values color-coded and superimposed on transverse slice 7 from couch position 10. The color-coded log-Jacobian images are superimposed on the transverse section of the second of the two image volumes, respectively. The contraction and expansion indicated by the log-Jacobian images agree with the change in volume indicated in the spirometry plot. In fact, the two measurements showed a correlation of R2=0.934. Figure 7 illustrates the distribution pattern of regions of expansion and contraction for 5 different patients in the same region of the lung at the same breathing phase. The red lines on the spirometry plots indicate the intervals in which the scans were made. The spirometry plots also indicate that the volumes of air exhaled and inhaled are different for each patient. From visual observations, it is difficult to find close correlation between the log-Jacobian images. However, what is interesting is that the log-Jacobian images of all patients in the exhalation phase appear to be inverses of their inhalation images. In other words, replacing red with magenta and vice versa of the exhalation images will result in a series of images that will resemble the inhalation images. This observation is most obvious with patient 2 and 4 images. The plot in Figure 8 shows the summary of the correlation of the difference in tidal volume between two consecutive image scans plotted against the average log-Jacobian value across the lung segmentation in slice 7 of the volume of all 5 patients. As it can be observed from the plot, the correlation of patients 1-4 is good in the superior portion of the lung. However, the correlation worsens as it gets closer to the middle section of the lung and then the correlation improves again as it approaches the inferior section of the lung. Patient 5 did not seem to produce a good correlation for the most part, except for the inferior portion of the lung. It was discovered that patient 5’s lungs were severely diseased, and that partly explains why the correlation of patient 5’s data was poor compared to the other four patients. Conclusion This poster presented preliminary results that show a good overall correlation (R=0.848 for all 5 patients and R=0.927 with patient 5 data excluded) between expansion/contraction determined from inverse consistent image registration of consecutive multislice CT image scans and spirometry data. This result suggests that the SICLE image registration algorithm is able to retro-actively track breathing motion of the lung across consecutive CT image acquisitions. Future work is needed to verify these findings and to use image registration to improve real-time conformal radiation treatment. Acknowledgements This work supported in part by NIH R01 96679, NIH R24 HL64368, and a corporate grant from Computerized Medical Systems. • Abstract • Breathing motion is one of the major limit-ing factors for reducing dose and irradiati-on of normal tissue forconventional conf-ormal radiotherapy. This poster describes a relationship between tracking lung moti-on using spirometry dataand image regi-stration ofconsecutive CT image volumes collected from a multislice CT scanner ov-er multiple breathingcycles. The temporal CT sequences from 5 individuals were a-nalyzed in this study. The couch was mo-ved from 11 to 14different positions to im-age the entire lung. At each couch positi-on, 15 image volumes were collected ov-er 2-3 breathingcycles. Small deformatio-n inverse consistent linear elastic (SICLE) image registration was used to register consecutiveimage scans. The log-Jacobian of these incremental transform-ations was computed to give a map of the local expansionand contraction of the lu-ng during thebreathing cycle. In four out of fivepatients, the correlation between the averagelog-Jacobian value and the differential spirometry data correlated well (R2 = 0.858 on average for the entire lun-g). Thecorrelation for the fifth patient was not as good (R2 = 0.377 on average for the entire lung) and can be explained by thesmall variation in tidal volume for this patient. The correlation of the average log-Jacobian value and the differentialsp-irometry data near the diaphragm correla-ted well in all five patients (R2 = 0.943 on average). • Introduction • Breathing motion is a significant source of error in radiotherapy treatment planning for the thoraxand upper abdomen.Incre-asing the beam aperture is the method u-sed to accountfor lung motion in convent-ional conformal radiotherapy which incre-ases the risk of delivering radiation dose to healthy tissue and critical organs. Sev-eral other methods have been proposedto account for breathing motion inducederror such as respiratory gating, couching and breath-hold.Image registration meth-ods can be used as a method to track lun-g motion and apply this informationfor ra-diotherapy treatment. In our previous pap-er, we have showed preliminary results fr-om correlating image registration results to spirometry volumemeasurements. In the paper, we have discussedhow there was a close relationship between the cha-nge in lung volume and theamount of co-ntraction/expansion measured by image registration of CT images acquired at infe-rior lung positions nearthe diaphragm. In this poster, the relationship between the i-mage registration results and the spirom-etry volumemeasurements was found for all locations of the lung. Also, anotewort-hy contraction andexpansion pattern fou-nd in the superior positions of the lung will be discussed in this poster. • Material and methods CT acquisition • 16-slice CT scanner operated in twelve-slice mode (Sensation 16, Siemens Medical Systems, Iselin, NJ). • 15 scans were acquired at each couch position. This process was repeated until the entire thorax was scanned (23–26 couch Positions). • The selection of 15 scans was based on the expectation of 3–4 s per breathing period, and the desire to acquire scans over 3 breathing cycles. Figure 8: Summary of R-values of the volume difference vs. log-Jacobian correlation of patients 1-5. The starting couch positions were aligned to illustrate the relationship between the R-value and the relative couch position. Figure 1: The inverse consistency error is defined as the distance between the starting and ending points produced by mapping a point through the forward and then reverse transformations. Figure 5:Spirometry volume vs. time for patient 3, couch position 10. The red crosses in this plot correspond to the air volume of the lung for the A through O CT volumes collected at couch position 10. Figure 6: Color coded log-Jacobian images superimposed on target CT volume for patient 3, couch position 10. Magenta corresponds to a contraction, red corresponds to an expansion, and green to no change. Panels show the Log-Jacobian superimposed on the CT for slice 7 for each of the 14 image registrations. The subscripts for each panel denote the direction of the transformation displayed. Figure 2:Illustration of how two sets of lung images are registered against each other. h(x) denotes the forward transformation while g(x) denotes the reverse transformation. Figure 3:Illustration of multiple sets of lung CT images (labeled A thru D) are registered against the adjacent images. Figure 7: The distribution pattern of regions of expansion and contraction for 5 different patients in the same region of the lung (near the RMB) at the same breathing phase. The top row are images taken during an exhalation phase while the bottom row are images taken during the inhalation phase. The red lines on the spirometry plots indicate the intervals in which the scans were made. It is interesting that the log-Jacobian images of all patients in the exhalation phase appear to be inverses of their inhalation images. Figure 4:Absolute difference images between the 5 temporally adjacent image volumes before and after nonrigid SICLE image registration for patient 3, couch position 10. Panels show the difference for slice 7. The subscripts for each panel denotes the volumes used in the difference. h(x) T(x) S(x) g(x)