Download
1 / 12
150 likes | 400 Vues
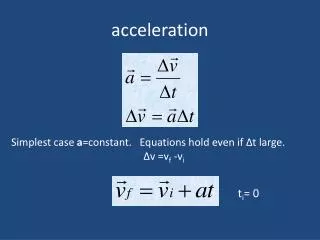
Acceleration lab. Goals : What does a distance vs. time graph look like for an accelerating object? How do we find the instantaneous velocity of an object using a distance vs. time graph. Background. Define all variables used in the lab and write-up. Include formula symbols and units

E N D
Acceleration lab • Goals: • What does a distance vs. time graph look like for an accelerating object? • How do we find the instantaneous velocity of an object using a distance vs. time graph.
Background • Define all variables used in the lab and write-up. • Include formula symbols and units • Time, distance, instantaneous velocity, acceleration. • Explain how a tickertape timer works • Explain what constant speed looks like according to a particle diagram of motion. (draw example) • On a distance vs time graph, explain what constant speed would look like (sketch an example)
Predictions 1. Will the falling weight be moving at constant speed or accelerating? 2. Based on this answer, what do you predict the tickertape will look like? • Draw it! 3. What will the distance vs. time graph of the falling weight look like? • Sketch the ‘shape’ of it
Materials • Ring stand, mass, old text book, tickertape, tickertape timer, meter stick. Lab Setup Ticker tape timer Ticker tape Ring Stand 500g mass Text book
Procedure • Set up your apparatus. • Rip off a piece of tickertape that is as long as the distance from the floor to the top of the ring stand. • Feed a piece of ticker tape UNDER the carbon circle. • Tape that end to the top of the mass • Turn on the tickertape timer • Drop the mass onto the book. (the tickertape should feed through the timer) • Turn off the timer. • Measure the distance from the start to every ______ dot.
GraphDistance vs. Time Distance (m) Time (s)
Pick a point ON your curve that is well defined. • Use a RULER to draw a line TANGENT to your graph at that point. • Pick a second point on your tangent line Finding Instantaneous Velocity POINT OFFLINE Distance (m) POINT ONLINE Time (s)
Finding Acceleration Instantaneous Velocity(m/s) Time (s)
conclusion • Was your object at constant speed or accelerating. • Sketch your tickertape. Did it match your prediction? • Sketch your d vs t graph, did it match your prediction? • Describe how you get instantaneous velocity on a distance vs time graph • What quantity does the slope of a velocity vs time graph represent (check the units) • Offer at least 2 sources of error • What is a future experiment that you could do?