Download
1 / 70
720 likes | 905 Vues
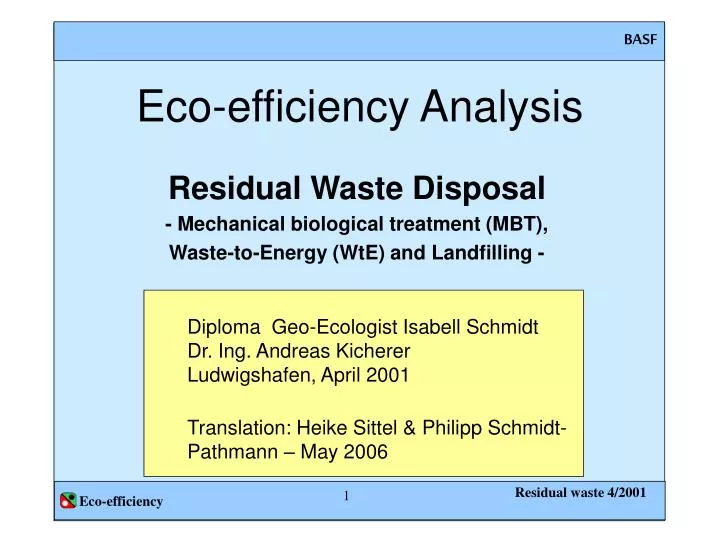
Eco-efficiency Analysis. Residual Waste Disposal - Mechanical biological treatment (MBT), Waste-to-Energy (WtE) and Landfilling -. Diploma Geo-Ecologist Isabell Schmidt Dr. Ing. Andreas Kicherer Ludwigshafen, April 2001 Translation: Heike Sittel & Philipp Schmidt- Pathmann – May 2006.

E N D
Eco-efficiency Analysis Residual Waste Disposal - Mechanical biological treatment (MBT), Waste-to-Energy (WtE) and Landfilling - Diploma Geo-Ecologist Isabell Schmidt Dr. Ing. Andreas Kicherer Ludwigshafen, April 2001 Translation: Heike Sittel & Philipp Schmidt- Pathmann – May 2006
Summary (1) • This Eco-efficiency study compares different disposal methods for residual waste. Landfilling of non-treated residual waste, which is going to stop in Europe in 2005 is compared to Waste-to-Energy (WTE) and Mechanical-Biological Treatment (MBT). • While current cost differences of the different disposal methods have shown no significant impact on the result of this analysis, there are major differences in environmental performance.
Summary (2) • Within the three disposal methods Waste-to-energy is the most eco-efficient. It is in particular favorable regarding energy and resource recovery (minimal final disposal). • In the overall result the Mechanical-biological treatment reaches only a middle rank in between Waste-to-Energy and Landfilling.
Summary (3) • Increased Eco-efficiency of the MBT can be achieved through improving the emission cleaning equipment as well treating the light material fraction (packaging of composite materials, plastics and metals) in WTE facilities.
Residual Waste Disposal Demand Related Utilization and System Variations: Defining demand related use 1. 2. Selection of process alternatives Disposal of 1t residual waste (Hu= 9,8 MJ/kg) Nil-variation landfill Thermal process: modern Waste-to-Energy (WtE) facilities Mechanical-biological treatment (MBT): enclosed intensified decomposing
The Systems cover the entire disposal chain… 3. Define system borderlines Electricity and steam generation (credit) Landfilling / sale of remnants Residual waste Garbage collection Transport WtE Production of fuel and construction materials Material utilization of remnants (credits) Transport The WtE System
…starting with the collection of the garbage… Landfilling of residuals Material utilization of remnants (credits) Residual waste Garbage collection Transport MBT intensified decomposing Variation: Thermal treatment of the light material fraction in WtE or cement plant Production of fuel and construction materials Transport The MBT System
…until the momentwhen all remnants -are utilized or deposited and no more substantial damage or costs are expected. Landfill gas power generation Cleaning of Leachate Residual waste Garbage collection Landfill (period: 100 years) Leftover of working and construction materials Transport The landfill system
Composition by trash type: 60% municipal solid waste 30% commercial waste similar to municipal solid waste Calorific value (Hu): 9,8 MJ/kg Characteristics of residual waste Trash fractions Source: In house calculation using Eco- Institute model, 1998
Assumption WtE*(base case) • Facility type stoker-fired furnace with cogeneration system • Yearly performance 320.000 metric tons • Dimensions (standardized) 2 x 21,5 Mg/h throughput with 9,7 MJ/kg refuse calorific value • Energy generation ** District heating Electricity max. district heating coupling: 75 MW 0 MW max. electricity uncoupling: 0 MW 23,8 MW yearly average (base case): 45 MW 4,0 MW • Area 6 ha • Operating life 20 years • Utilization of remnants Slag Use in road construction Boiler dust, Salt mixtures Mine offset Flue gas dust (hazardous waste) Mine offset Metal, Gypsum, HCl Sale as product *Calculation of WtE is based on data from the WtE facility Rugenberger Damm (MVR) **Excluding own power usage: 4,2 MW electricity, 30 t/h steam (22,5 MW) Source: MVR, 1999: 21ff.
Most important inputs/outputs WtE N OUT WtE I • Amount adjusted to waste input, thus not identical with MVR • ** Bibliographical reference • WtE facilities are usually run without water discharge.
Assumptions MBT (base case) • Facility type intensified decomposing • Yearly performance 30.000 metric tons • Mechanical level see above procedure scheme • Biological level encapsulated table window method, decomposition for 16 weeks, waste water free operation • Waste air purification Air scrubber and bio filter • Area 2,6 ha • Operating life 20 (years) • Retention of remnants Scrap metal Sale as product Impurity material Municipal waste landfill Light materials Municipal waste landfill (Scenarios: WtE/Concrete facility) End product Municipal waste landfill Source: Wallmann, 1999 a.o.
FLow-Chart MBT Scrap Metal Impure materials Removal of scrap metal Conveyor band magnet + Separation of impure material Sifting Baler Rough crushing (only bulky refuse) Bulky refuse Light material (Hu= approx. 16 MJ/kg) > 100mm Screening Rotary drum strainer Fine crushing Screw crusher Municipal solid/ Commercial waste < 100mm approx. 80% of the input Blending/ Homogenisation Mechanical level ( encapsulated) Exhaust air Biological level (encapsulated) Exhaust air Intensified decomposing phase 16 weeks, 65% biologically organic dry matter degradation Emission treatment Scrubber + Bio filter Decomposed product Source: Wallmann, 1999
Most important inputs/outputs MBT N OUT MBT intensified decomposing I Zero waste waterdischarge
Assumptions landfill Balance time period 100 y 30% diffuse escaping landfill gas (60% CH4- Oxidation) Initial loss through aerobic degradation (100% CO2) 800 mm yearly precipitation Waste air Installation densities: Non-treated residual waste: 1,0 t/m3 Decomposed product: 1,4 t/m3 Slags: 1,7 t/m3 Average height: 20m Gas engine (26% energetic occupancy rate) 70% caught landfill gas (55% CH4 + 45% CO2) Seeping water cleaning system Seeping water amount: a) Installation phase (10 a): 25% precipitation b) with drying: 200 l/t c) after insulation: 10 mm/a Cleaned seeping water Source: Schwing, 1999 and others
Most important inputs/outputs landfill N OUT I Landfill
Assumption costs Specific treatment costs * WtE: 250 DM/t (including downstream steps) MBT: 69 DM/t (without downstream steps) 145 DM/t (incl. downstream steps) Landfilling costs untreated refuse: 120 DM/t pretreated refuse and slag: 60 DM/t hazardous refuse (underground): 375 DM/t Trash collection 140 DM/t Transport costs 0.20 DM/tkm Transport costs (Truck 40t, 50% fill rate) plus 23 DM/t Loading costs *Glossary: The specific costs for treatment of the WtE facility equal the real costs of the WtE facility Rugenberger Damm (Hamburg) and cover all costs of associated final transport and treatment steps. To guarantee a better comparison to the WtE facility the cost balance of the MBT was taken from a bigger plant (>200.000 t/a). The costs do not include the costs from the transport and treatment steps required afterwards. The fixed costs of the WtE as well as the MBT are about 80% of the specific treatment costs. The dependence of the treatment costs on the usage rate of the plant is the same for both disposal methods. Source: UBA, 1999 and others
Counted credits * Due to the required costs in mine stabilization no credits for boiler dust, salt mixtures and flue gas dust are calculated. The remnants are counted as refuse.
Data quality Data quality: very high: firsthand, e.g. company data (measured) high: studies and qualified literature medium: qualified estimated values, e.g. company data (estimated values), estimations of experts
MBA/MBT WtE Landfill The Eco-efficiency portfolio combines costs with environmental impact. Base case Disposal of 1 t residual Waste (9,8MJ/kg) Considered alternatives Environmental impact (standardized) Costs (standardized) Leichtstoffverbrennung MVA= Incineration of light materials in the WTE Leichtstoffverbrennung Zementwerk = Incineration of the light materials in cement facility
Commentary for the Eco-efficiency portfolio 1 • The pretreatment of residual waste demonstrates a significant ecological improvement in comparison to conventional landfilling • The cost difference between the three chosen disposal variants are not important compared to the ecological differences
Commentary for the Eco-efficiency portfolio 2 • Waste-to-Energy is the most expensive, but by far the most eco-efficient way for residual waste disposal • The Eco-efficiency of Mechanical Biological Treatment reaches a middle rank compared to Waste-to-Energy and Landfilling
COST FACTOR Waste collection Facility operation (fixed cost) Additional transport and Landfilling of remnants of MBT process POLLUTION ORIGIN Amount of non-usable remnants that have to be landfilled Un-used energy contained in residual waste Direct air polluting emissions The main cost and origin ofenvironmental pollution are identified.
MBT WtE Landfill Total Cost Garbage collection and facility operations represent the highest costs of the disposal chain. The obtained profits from the sale of the energy (2 cents per kW) and materials recovered/produced have only a limited impact. Transport of remnants, construction and operation materials Landfilling and/or offset of remnants Facility operation and capital costs Garbage collection Revenues from material utilization Revenues from power generation DM/t residual waste
Direct landfilling of residual waste is less expensive than pretreatment. • WtE • WtE has the highest disposal costs due to the extensive technical operation (high investment costs). • Revenues from the sale of energy and materials are limited. • MBT • The direct treatment costs of MBT are • comparatively low (relatively low investment costs). • The huge amount of remnants (end-product, disruptive or light materials) cause relatively high costs for the consecutive transport and landfilling. • Landfill • The direct landfilling of non-treated residual • waste occasion in general the lowest disposal costs.
Ecological fingerprint Worst alternative = 1; all others are rated in correalation Energy consumption Standard assumptions for environmental pollution: Material consumption 20% Energy consumption 20% Area 10% Emissions 20% Toxicity potential 20% Danger potential 10% Area requirements Emissions Toxicity potential Landfill WtE MBT Material consumption Risk Factor
Commentary to the ecological fingerprint • Recovered energy from WtE in form of electricity and district heating as well as the recovered end-products replace other environmental damaging production processes. As a result WtE saves a lot of resources, energy and emissions compared to the alternative options. • The results show that MBT is the better solution to landfilling. The energy balance however of the landfill is favorable to MBT if the methane is recovered as energy. • Over a longer period of time (100 years) the area used for landfilling has a much bigger impact on the land than the treatment facilities. The WtE facility of Hamburg scores well, since almost no remnants occur. • The toxicity potential includes the Human- and Eco-toxicity of the air and water emissions from waste pre-treatment, landfilling and the use of slag in road construction. • When calculating the risk factor, accidental risks, hygienic risks, noise emissions and drifts (aesthetic damage to the landscape caused by paper and plastic litter) have been taken into account.
Landfill WtE MBT Primary energy consumption The use of the energy content of garbage is determining the energy balance. In contrast the energy needed for garbage collection and transport carry almost no weight. Landfilling and/or removal of remnants Facility operation (incl. construction and working materials) Garbage collection and transport Utilization of recovered materials MJ/ t residual waste
WtE saves primary energy • MBT • MBT has the most unfavorable energy balance, because there is no utilization of the energy contained in the residual waste compared to the other disposal alternatives. • The recovery and utilization of scrap metal compensates for the vast amount of energy necessary for the production of raw iron. • Landfill • Energetically, landfilling performed slightly better than MBT because of the utilization of the landfill gas (methane). • WtE • The net saved primary energy which is caused by the efficient energy use and the material recovery and utilization reaches with app. 6500 MJ/t residual waste about two third of the waste’s calorific value.
Iron Stone and soil Lignite coal Natural gas Mineral oil Coal Others MBT WtE Landfill Material use* The choice of the disposal route affects the conservation/protection of mineral resources and iron. Non renewable fossil fuels can also be substituted by the utilization of the waste’s calorific value of the WtE. Kg rock salt equivalent/t residual waste *The individual raw materials are rated according to their reserve capacity.
Landfilling causes the biggest resource consumption. • Landfill • The construction of the landfill consumes the highest amount of natural non-renewable resources, especially for the landfill liners and covers (sealants) • MBT • The MBT has a huge consumption of stones and soil because of the big amounts of the remnants which have to be landfilled. • The material balance is steadied by the recovery and utilization of iron scrap. Material consumption standardized • WtE • The generated steam from the facility substitutes the produced steam from natural gas. • The iron and mineral resources are gone easy on through the material use.
Building rubble (0,2 times weighted) Hazardous waste (fivefold weighted) Municipal waste (simple weighted) Landfill waste* From the original ton of residual waste different amounts of garbage have to be landfilled. kg- municipal waste- equivalent/ t residual waste MBT WtE Landfill *weighted (see legend)
Only WtE is able to reduce the residual waste that has to be landfilled significantly. • Landfill • All residual waste is being dumped. • The allocation of construction materials causes additional mineral garbage • MBT • In spite of intensive pretreatments about two third (690 kg) of the residual waste remains for Landfilling. • Furthermore building rubble is produced when needed electricity and construction materials are allocated. Waste standardized • WtE • The residual waste can be reduced to a minimum by combustion and utilization of slag. • But WtE is the only process that produces 12 kg hazardous waste (fly and boiler ash).
Power generation Utilization of remnants Use of WtE- slag (road construction) Construction and operations materials Landfill leachate Garbage collection and transport Emissions resulting from sewage/leachate The leachate from landfills causes the main water/groundwater pollution. However, credits from the generation of electricity have advantages for the sewage/leachate balance. Critical volume* (liter)/t residual waste WtE MBT Landfill *The critical volume indicates the theoretical amount of water, which would be polluted until the individual pollutants reach their legal limits (method: see appendix).
Landfilling is at a major disadvantage in regards to water contamination • Landfill • The landfilling of the untreated residual waste causes the worst water contamination. • MBT • Just like WtE, MBT causes no direct water contamination, since the generated waste wateris used for internal systems. • The leachate emission from the sedimentation of the decomposed product as well as of the impure and light materials are still significant. water contamination standardized • WtE • WTE receives power generation credits from avoided water contamination. • The weak-point is the bottom ash . However, proper/correct placement in road construction and the high pH-balance result in minimal water exposure and prohibit the leakage of heavy metals.
power generation Material utilization of remnants Facility operation (incl. construction and operation materials) Garbage treatment (incl. construction- and operation materials) Garbage collection and transport Greenhouse effect The higher the production and utilization of energy and end products the higher the environmental relevance. kg- CO2- equivalent/ t residual waste Landfill WtE MBT
Landfill gas emission Emissions from the pretreatment stage MBT Landfill WtE Ozone Destruction Potential More halogenated hydrocarbons are emitted through the biological decomposing processes in landfills and MBT than through waste incineration. Compared to landfilling large amounts of emissions are released during the pretreatment stage. g R-11- equivalent/ t residual waste
Energy recovery Utilization of process end-products Facility operation (incl. construction- and operation materials) Pretreatment (incl. construction- and operation materials) Garbage collection and transport WtE Landfill MBT Photochemical ozone creation potential Methane and other volatile organic compounds are released through the biological decomposition of waste in MBT and landfilling and contribute to summer smog. In addition, truck-traffic contributes significantly to the destruction of the ozone layer. g Ethene- equivalent/ t residual waste
Generation of Energy Utilization of process end-products Facility operation (incl. construction- and operation materials) Pretreatment (incl. construction- and operation materials) Garbage collection and transport WtE Landfill MBT Acidification potential Key for the acidification potential are the credits for the production of energy and usable end-products. g SO2- equivalent/ t residual waste
The evaluation of the emissions/air pollution shows that WtE is the best performer. • Landfill • The Landfilling of the untreated residual waste causes the worst pollution concerning all four tested effect categories for air pollutants*. • MBT • The landfill gas potential is highly reduced by the mechanical-biological pre-treatment of waste. • The utilization of only standard emission treatment through bio-filter and air-purifier result in a higher emission potential of the MBT facility. Air pollutants* standardized • WtE • Due to the strict limits of the 17th Clean Air Act the emissions are significantly lower. • The production of energy and usable end-products result in additional reductions of emissions. *Greenhouse potential, Ozone destruction potential, photochemical ozone creation potential, Acidification potential
The garbage shows the biggest effect in the evaluation of all emissions. • Landfill • In regards to the three categories emissions, water pollution and waste landfilling is always the worst alternative. Thus landfilling shows also as the worst alternative in the overall evaluation of emissions. • MBT • The limited reduction of the waste is reflected in the overall evaluation of emissions – still high. All emissions* standardized • WtE • Waste incineration significantly reduces the volume of the waste. • Emissions and water contamination are offset by the credits for energy and usable end products. *Pollution (8%), waste water(2%) and Garbage (90%)
Traffic area for the transport of other goods Traffic area for waste collection Landfilling Pretreatment WtE Landfill MBT Area requirements* In general, most relevant for the area requirements is the waste which has to be dumped. This area can not be used for a very long period of time. Important is also the area required for the necessary transport of materials. On the other hand the area for pretreatment is minimal. m2/ t residual waste *over a time period of 100 years
MBT requires about four times the space of incineration. • Landfill • For every ton of untreated residual waste a landfill area of 0,1 m2 is needed and a traffic area of 0,02 m2. • The total area requirements are the highest with 0,12m2/t residual waste . • MBT • The large amounts of process remnants (total of 690kg) require a significant amount of space. Despite compressed disposal the decomposed product itself requires about 0,04 m2 landfill space. • The area requirements for the MBT facility itself is higher than that of the WtE facility. Area utilization standardized • WtE • The area requirements of WtE are influenced by the road transports which amount to 0,02m2/t residual waste. • There is no need for surface area landfilling as the few to be landfilled remnants are utilized in salt mines. • Due to the high waste throughput area requirements per ton are relatively small.
Organic compound (incl. PCDD/F) SM & other inorganic compounds SO2 H2S CO NOX WtE Landfill MBT Human toxicity potential - Pollution The determination of the toxicity potential is created by the Human- and Eco toxicology potential of air and water emissions.* Nitric oxides play the key role in determining the human toxicity potential compared to dioxins who are only minimal. g Human tox.- equivalent/ t residual waste Only emissions from pretreatment, landfilling of the residual waste and decomposed product as well as the utilization of bottom ash in the construction of roads are considered in the determination of the toxicity potential. Pollutants are calculated based on EU hazardous waste guidelines (Human-tox.: Xi = x 1; Xn,C = x 10; T = x 100; T+ = x 1000; Eco-tox.: N = x 1).
WtE Landfill MBT Human toxicity potential – Water emissions WtE and MBT are waste water free operations. The water emissions originate in case of WtE from slag, in case of the MBT from landfilling the remnants. Slag emits mostly heavy metals, while the main pollutants of landfill leachate are organic substances and ammonia, Other organic compounds Tetrachloroethylene Toluene SM and other inorganic substances Ammonia g Human tox.- equivalent/ t residual waste
Others Tetrachloroethylene 1,1,1 - Trichloroethan H2S NO3 WtE Landfill MBT Eco toxicology potential - Pollution MBT emits more ammonia, while the eco-toxicity potential of the landfill originates mostly from hydrogen sulfide emissions. g Eco tox. - equivalent/ t residual waste
Others Tetrachloroethylene WtE Landfill MBT Eco toxicology potential – Water emissions According to the EU-Dangerous Substances Ordinance, Tetrachloroethylene (Tetrachlorethen) is the only water pollutant that is emitted in considerable amounts. g Eco tox. - equivalent/ t residual waste
Eco-tox. water Eco-tox. air Others Tetrachloroethylene WtE Landfill MBT Total toxicology potential* In the overall evaluation of the toxicity potential landfills and WtE are heaviest impacted by the Human-toxic pollutants while MBT is mostly impacted by the Eco-toxic pollutants. Total toxicity potential (relative units) *Human - and Eco toxicity potential for air and water emissions are weighted as follows: Human- to Eco toxicity potential: 70:30; Air to Water emissions ( according to relevance factors): 81:19.