Download
1 / 23
230 likes | 407 Vues
Summary of NC200 work. Imran & Norli Updated : 2/8/2007. Objectives. To get high dispersion of nanocarbon on AC. To get homogeneous nanocarbon. Experimental Route Diagram. Substrate (AC). Washing (removes impurities; eg: Al, Si, Fe, K). treat with 5M HNO 3 , T=30 o C, 24 hr

E N D
Summary of NC200 work Imran & Norli Updated: 2/8/2007
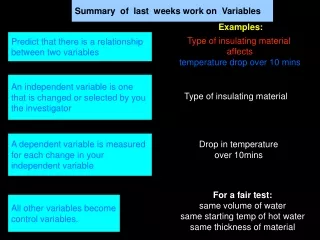
Objectives • To get high dispersion of nanocarbon on AC. • To get homogeneous nanocarbon.
Experimental Route Diagram Substrate (AC) Washing (removes impurities; eg: Al, Si, Fe, K) • treat with 5M HNO3, T=30oC, 24 hr • wash with deionized water, dried T=200oC, 2 hr • Acid Base Titration • Iodine Number • Butane Activity Catalyst Development Impregnation Characterization CNT/F Application • Cat. + acetic acid/ ethanol • under ultrasonic, 30 min, 25oC (water bath) • aging 45hr/12hr, RT, Drynoza • Monometallic (Iron) • Bimetallic • Compositional analysis (EDX,XRF) • Morphology/Structure analysis (SEM, HRTEM) • Texture/Surface Area analysis (BET) • Mechanical & Electrical Properties Analysis Nanocarbon Growth (Thermal-CVD) CNT/F • Carbon source (C2H4) • Carrier gas (H2, N2)
Working Summary • Drying method: • Previous: Oven • Current: Drynoza • UTP Temperature Programme: • Previous: Calcination: 250oC, 5% O2 in N2, 1hr, Reduction: 300oC, 5% H2 in N2, 1hr, Growth: 700oC, 30mL C2H4, 200mL H2, 2 hrs • Current: Calcination: 250oC, 5% O2 in N2, 1hr, Reduction: 500oC/700oC, 5% H2 in N2, 1hr, Growth: 700oC, 30mL C2H4, 200mL H2, 2 hrs
Parameters Iron (II) Acetate Iron (II) Nitrate
Temperature Programme (New) 60 min 120 min 134 min 100 min 60 min 10 min 60 min 44 min Calcination Reduction Growth Cooling 30 min
SEM images for CNT/AC NC2FA1(B4)
SEM images for CNT/AC NC2FA1(Growth) CNT diameter: 6-11nm. Some CNT growth from the pore. Dispersion was not very good. High concentration of solution. Try to use 1M acetic acid solution
SEM images for CNT/AC NC2FA2(B4) with 1M acetic acid solution
SEM images for CNT/AC NC2FA2(Growth) No/less CNT growth (most probably because of the drying factor/solution concentration. Try to use different drying method
SEM images for CNT/AC NC2FA4(B4) DRYNOZA+new temp. programme
SEM images for CNT/AC NC2FA4(Growth) CNT diameter: 5-12 nm Drynoza+new temp. programme Dispersion still not very good. Check the catalyst dispersion after reduction process (in progress)
SEM images for CNT/AC E084 (500oC) • Less growth, most probably Fe is not fully reduce • not cover all AC substrate • diameter 8nm – 15nm
SEM images for CNT/AC E090 (700oC) stick
SEM images for CNT/AC E090 (700oC) loose
BET • BET data for NC2FA3 & NC2FA4 still in progress.
BET Isoterm & DFT Iron (II) Acetate Isoterm DFT All samples show isoterm type I (micropore) and hysteresis H3 (inuniform slit type). DFT proved that this sample are micropore which diameter between 3-20 A.
Thermal Analysis Iron (II) Nitrate Thermal Analysis condition = air, 32oC – 900oC, rate 5oC/min • less 200oC loss of water molecules, moisture and nitrate • 500oC – 750oC – removal of SOFG • 350oC – 600oC – reduction of Fe nitrate. The width and density of the endothermic peak refers to the contact between the metal and carbon surface in other words it shows the characteristic of metal dispersion of the iron / nickel on AC. (prove from TG of sample Ni/AC 1wt%/2wt%) • some literature mention, the 4th peak in TGA refers to the second activation of the Fe after being covered by coke and/or the Fe is in a different position in AC matrix, AC raw dont have this peak maybe probably because they present in a different state (Fe silicates etc).
Thermal Analysis Iron (II) Nitrate Thermal Analysis condition = air, 32oC – 900oC, rate 5oC/min * App. Catal A. 192 (2000) 29-42
Absorption band [cm-1] assignment 3417 O-H stretching vibrations, existence of surface hydroxylic groups and chemisorb water, asymmetric of this band indicates strong hydrogen bonds 2916, 2850 Aliphatic species, -CH3 –CH2- 1731 Aromatic rings and double bond vibrations 1579 Conjugated system such as ketone, keto-ester, ketol-enol structures 1385 NOx species from HNO3 1102 Symmetrical stretching vibration of ether ; epi-oxide and phenolic structure in different environmental. FTIR – Surface Oxygen functional group Iron (II) Nitrate * Carbon 36 (1998) 1821-1831
XRD Diffractogram Iron (II) Nitrate XRD diffractogram of samples was indexed to Fe3C and graphite. XRD diffraction patterns recorded after the reactions shows that the pattern of Fe oxide is no longer present after CVD and the phases present were graphite and Fe carbide. Some literature says that Fe oxide precursor was converted to Fe3C either during or after the CVD process. Fe3C also expected to form at the reaction conditionsa. Active phase could be iron carbide or some form of iron carbon solid solutiona. * Carbon 44(2006) 2273-2280
XRD Iron (II) Acetate
Current & Future Planning • Produce large amount of Fe/AC for iodine number and acid base titration (each experiment require 10gram of sample) • To set-up apparatus to perform n-butane activity.