Download
1 / 2
20 likes | 188 Vues
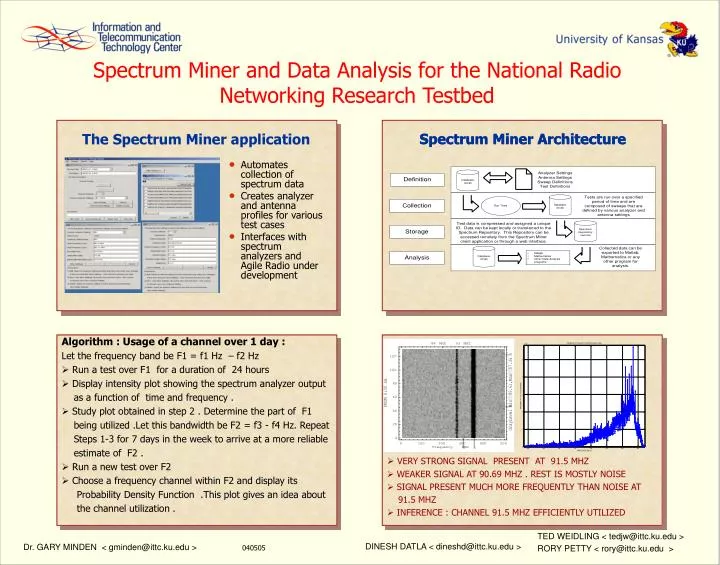
Spectrum Miner and Data Analysis for the National Radio Networking Research Testbed. Spectrum Miner Architecture. Spectrum Miner Architecture. The Spectrum Miner application. Automates collection of spectrum data Creates analyzer and antenna profiles for various test cases

E N D
Spectrum Miner and Data Analysis for the National Radio Networking Research Testbed Spectrum Miner Architecture Spectrum Miner Architecture The Spectrum Miner application • Automates collection of spectrum data • Creates analyzer and antenna profiles for various test cases • Interfaces with spectrum analyzers and Agile Radio under development Algorithm : Usage of a channel over 1 day : Let the frequency band be F1 = f1 Hz – f2 Hz • Run a test over F1 for a duration of 24 hours • Display intensity plot showing the spectrum analyzer output as a function of time and frequency . • Study plot obtained in step 2 . Determine the part of F1 being utilized .Let this bandwidth be F2 = f3 - f4 Hz. Repeat Steps 1-3 for 7 days in the week to arrive at a more reliable estimate of F2 . • Run a new test over F2 • Choose a frequency channel within F2 and display its Probability Density Function .This plot gives an idea about the channel utilization . • VERY STRONG SIGNAL PRESENT AT 91.5 MHZ • WEAKER SIGNAL AT 90.69 MHZ . REST IS MOSTLY NOISE • SIGNAL PRESENT MUCH MORE FREQUENTLY THAN NOISE AT 91.5 MHZ • INFERENCE : CHANNEL 91.5 MHZ EFFICIENTLY UTILIZED DINESH DATLA < dineshd@ittc.ku.edu > TED WEIDLING < tedjw@ittc.ku.edu > RORY PETTY < rory@ittc.ku.edu > Dr. GARY MINDEN < gminden@ittc.ku.edu > 040505
Poster Example Project Concept Goals and Objectives • Project Milestones and Achievements • “Bullet Point” the ideas behind the Project Example/Graphic Image ProjectImpact Photos, graphs, or other results of the work • Why is the work important?