Download
1 / 1
10 likes | 120 Vues
4. 4. 3. 3. sugar concentration log ng/µl serum or ng/µg. sugar concentration log ng/µl serum or ng/µg. 2. 2. 1. 1. 0. 0. Suppl. Fig. 2. A. B. C. i.p. oral L-arabinose. oral L-rhamnose. 4. Serum. Serum. L-arabinose. Cecum. Cecum. L-rhamnose. SI. SI. 3. LI. LI.

E N D
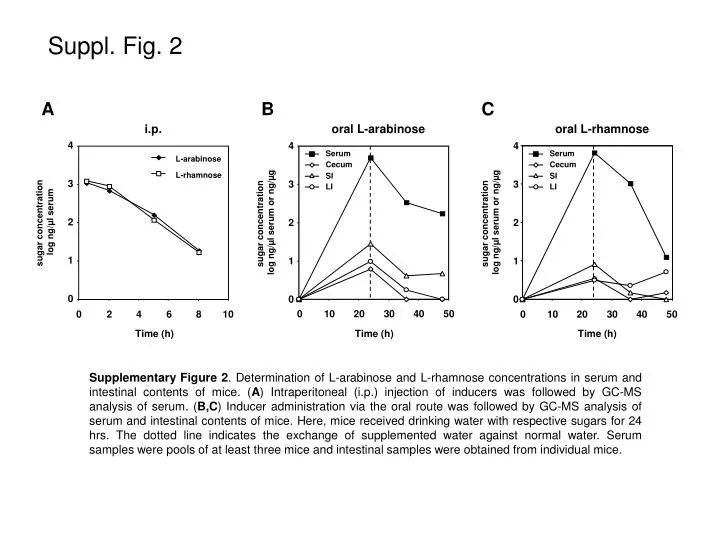
4 4 3 3 sugar concentration log ng/µl serum or ng/µg sugar concentration log ng/µl serum or ng/µg 2 2 1 1 0 0 Suppl. Fig. 2 A B C i.p. oral L-arabinose oral L-rhamnose 4 Serum Serum L-arabinose Cecum Cecum L-rhamnose SI SI 3 LI LI sugar concentration log ng/µl serum 2 1 0 0 10 20 30 40 50 0 2 4 6 8 10 0 10 20 30 40 50 Time (h) Time (h) Time (h) Supplementary Figure 2. Determination of L-arabinose and L-rhamnose concentrations in serum and intestinal contents of mice. (A) Intraperitoneal (i.p.) injection of inducers was followed by GC-MS analysis of serum. (B,C) Inducer administration via the oral route was followed by GC-MS analysis of serum and intestinal contents of mice. Here, mice received drinking water with respective sugars for 24 hrs. The dotted line indicates the exchange of supplemented water against normal water. Serum samples were pools of at least three mice and intestinal samples were obtained from individual mice.