Download
1 / 31
320 likes | 593 Vues
Population Geography I (Demography). The Where and Why of Population Density (Concentration) Distribution (Location) Demographics (Characteristics) Dynamics (Over time) Interpretation. Population Density.

E N D
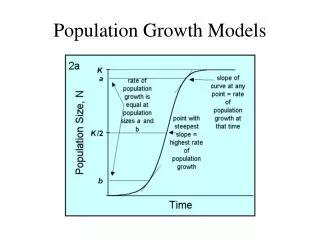
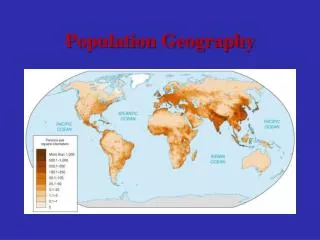
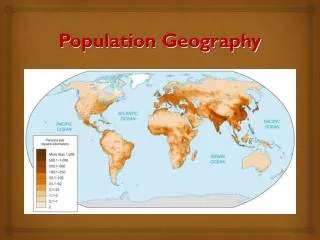
Population Geography I(Demography) The Where and Why of Population • Density (Concentration) • Distribution (Location) • Demographics (Characteristics) • Dynamics (Over time) • Interpretation
Population Density • Not only WHERE people are located, but the DISTRIBUTION (clustering or dispersion) of people across or within a given region • Measured in people per unit of area • People per square mile (mi2) • People per square kilometer (km2) • People per acre
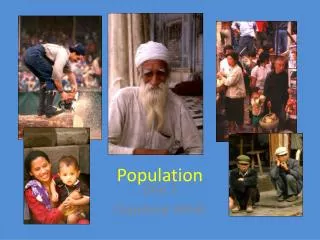
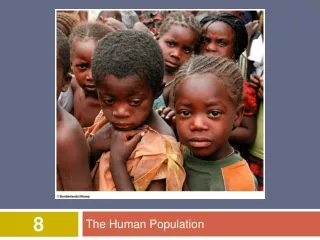
Demography(Population characteristics) • Ascribed • Gender • Race • Age • Achieved • Education • Income • Occupation • Employment • Etc.
Census:Count of population and its characteristics According to the U.S. Census Bureau, the total population of the World, projected to 3/31/14 at 15:57 GMT (CDT+5) was7,092,472,645
Population Statistics • Birth Rate (per 1,000) • Death Rate (per 1,000) • Fertility Rate (Children born/Woman) • Infant Mortality Rate (per 1,000) • Natural Increase % (Births – Deaths per 1,000) • Life Expectancy (years)
Infant Mortality Rate(deaths of infants <1 year old) Lack of maternal health care or child nutrition
DynamicsRate of Natural Increase (RNI) Births - Deaths RNI
RNI Figures (%) “PERIPHERY” Uganda 3.4 Niger 3.4 Mali 3.2 Burkina Faso 3.1 Senegal 2.7 Afghanistan 2.5 Iraq 2.4 Tanzania 2.0 Philippines 2.0 Honduras 1.9 Bolivia 1.7 “SEMI-PERIPHERY” Mexico 1.4 India 1.4 Brazil 1.1 “CORE” United States 0.5 China 0.5 France 0.4 Canada 0.2 Denmark 0.0 Hungary -0.3 Serbia -0.5 Ukraine -0.6
Doubling Time“Rule of 70” • Number of years it will take for population to double at current growth rate • 70÷Growth Rate =Doubling Time • Growth Rate Doubling Time • Uganda3.4%21 years • Afghanistan 2.5% 28 years • India 1.4% 50 years • United States .5% 140 years • Denmark 0.0% -- • Ukraine -0.6% 117 years* (1/2)
Dependency Ratio • Dependents: Under 15 & over 65 • How many supported by 15-65 group? • Problems?
“Graying of the Core” • Low birth and death rates in Core • Low population growth (not including immigration) • Steadily older population
Baby Boom (1946-1964) Baby Bust (1965-1980)
Demographic Transition 1 2 3 4
Stages of Demographic Transition • 1. Pre-Industrial Equilibrium • (High BR, High DR = • basic, subsistence living) • 2. Early Industrialization • (High BR, Declining DR = • better sanitation, health care) • 3. Developed Industrialization • (Declining BR, Low DR = • “modernization,” change of values) • 4. Post-Industrial Equilibrium • (Low BR, Low DR) = • “fully developed”—core countries today • 5. Deindustrialization • (BR is lower than DR = • “fully developed”—losing manufacturing 1 2 3 4 5 • Which Stage? • Core? • Periphery? • Semi-Periphery?
Demographic Transition in Denmark Core (low birth / death rates)
Demographic Transition in Chile Semi-Periphery (lower death rates, falling birth rates)
Demographic Transition in Cape Verde, Africa Periphery (high birth, high death rates)
Thomas Malthus (1766-1834): Theory of “Overpopulation” • Famine • Disease • War
Policies to lower birth rate • Forced • One-child policy (China) • Coercive “population control” • Gynocide • Infanticide • Voluntary • Availability of birth control • Incentives for small families • Social • Empowerment of women • Better health care and education • Significant decrease in child labor • Social Security