Download
1 / 3
30 likes | 231 Vues
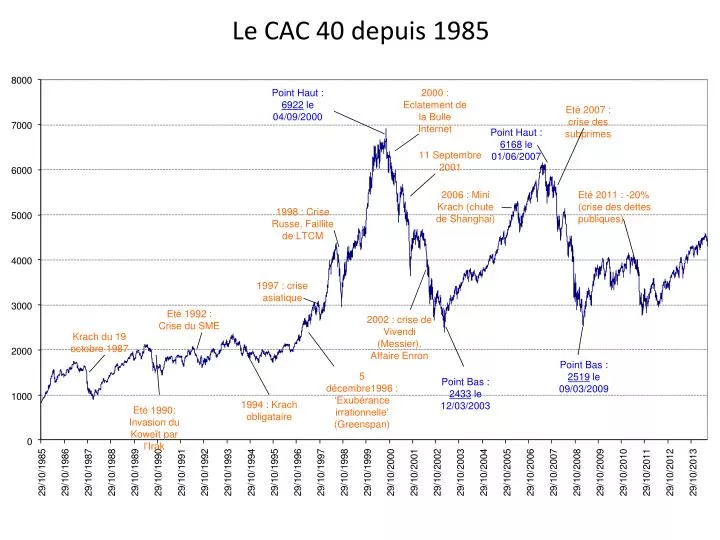
Point Haut : 6922 le 04/09/2000. 2000 : Eclatement de la Bulle Internet. Eté 2007 : crise des subprimes. Point Haut : 6168 le 01/06/2007. 11 Septembre 2001. 2006 : Mini Krach (chute de Shanghai). Eté 2011 : -20% (crise des dettes publiques). 1998 : Crise Russe, Faillite de LTCM.

E N D
Point Haut : 6922 le 04/09/2000 2000 : Eclatement de la Bulle Internet Eté 2007 : crise des subprimes Point Haut : 6168 le 01/06/2007 11 Septembre 2001 2006 : Mini Krach (chute de Shanghai) Eté 2011 : -20% (crise des dettes publiques) 1998 : Crise Russe, Faillite de LTCM 1997 : crise asiatique Eté 1992 : Crise du SME 2002 : crise de Vivendi (Messier), Affaire Enron Krach du 19 octobre 1987 Point Bas : 2519 le 09/03/2009 5 décembre1996 : ‘Exubérance irrationnelle’ (Greenspan) Point Bas : 2433 le 12/03/2003 1994 : Krach obligataire Eté 1990: Invasion du Koweït par l’Irak Le CAC 40 depuis 1985
Indice S&P 500 en termes réelsSource : Robert Shiller, L’Exubérance irrationnelle (mis à jour) 2000 2007 2003 2009 1987 1973 1929 1937 1946 1975 1982 1932