Download
1 / 1
10 likes | 129 Vues
Fig. 5: Seasonal cycle of regional-average daily-average surface T. Errorbars are 1-standard deviation values from monthly data. Fig. 2: Annual-average precipitation climatology. Regions used in subsequent plots are labeled in the 3 rd panel. UW. WRF. CCSM. 44 42 40 38 36 34 32. 7.6

E N D
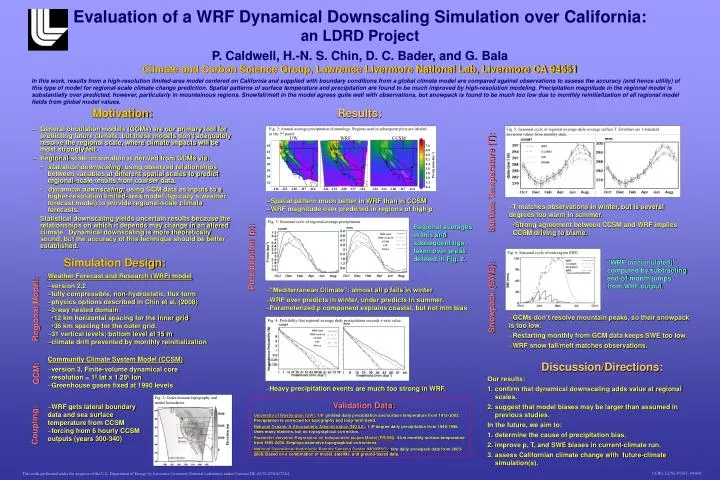
Fig. 5: Seasonal cycle of regional-average daily-average surface T. Errorbars are 1-standard deviation values from monthly data. Fig. 2: Annual-average precipitation climatology. Regions used in subsequent plots are labeled in the 3rd panel. UW WRF CCSM 44 42 40 38 36 34 32 7.6 6.8 6.0 5.2 4.4 3.6 2.8 2.0 1.2 0.4 Fig. 6: Seasonal cycle of mtn-region SWE. mtn coast valley Precip (mm day-1) SoCal -126 -123 -120 -117 -114 -126 -123 -120 -117 -114 -126 -123 -120 -117 -114 Fig. 3: Seasonal cycle of regional-average precipitation. WRF total WRF resolved CCSM UW NOAA Fig. 1: Outer-domain topography and model boundaries 3000 2000 1000 0 Fig. 4: Probibility that regional-average daily precipitation exceeds x-axis value. Elevation (m) inner domain WRF total WRF resolved CCSM UW NOAA outer domain University of Washington (UW): 1/8º gridded daily precipitation and surface temperature from 1915-2003. Precipitation is corrected for topography and long-term trend. National Oceanic & Atmospheric Administration (NOAA): 1/4º degree daily precipitation from 1948-1998. Uses many stations, but no topographical correction. Parameter-elevation Regression on Independent slopes Model (PRISM):4 km monthly surface temperature from 1895-2006. Employs extensive topographical corrections. National Operational Hydrologic Remote Sensing Center (NOHRSC): 1km daily snowpack data from 2003-2008. Based on a combination of model, satellite, and ground-based data. Evaluation of a WRF Dynamical Downscaling Simulation over California: an LDRD Project P. Caldwell, H.-N. S. Chin, D. C. Bader, and G. Bala Climate and Carbon Science Group, Lawrence Livermore National Lab, Livermore CA 94551 In this work, results from a high-resolution limited-area model centered on California and supplied with boundary conditions from a global climate model are compared against observations to assess the accuracy (and hence utility) of this type of model for regional-scale climate change prediction. Spatial patterns of surface temperature and precipitation are found to be much improved by high-resolution modeling. Precipitation magnitude in the regional model is substantially over predicted, however, particularly in mountainous regions. Snowfall/melt in the model agrees quite well with observations, but snowpack is found to be much too low due to monthly reinitialization of all regional model fields from global model values. Motivation: Results: • General circulation models (GCMs) are our primary tool for predicting future climate, but these models don’t adequately resolve the regional scale, where climate impacts will be most strongly felt. • Regional-scale information is derived from GCMs via: • statistical downscaling: using observed relationships between variables at different spatial scales to predict regional-scale results from coarser data. • dynamical downscaling: using GCM data as inputs to a higher-resolution limited-area model (typically a weather forecast model) to provide regional-scale climate forecasts. • Statistical downscaling yields uncertain results because the relationships on which it depends may change in an altered climate. Dynamical downscaling is more theoretically sound, but the accuracy of this technique should be better established. Surface Temperature (T): • Spatial pattern much better in WRF than in CCSM • WRF magnitude over predicted in regions of high p. • T matches observations in winter, but is several degrees too warm in summer. • Strong agreement between CCSM and WRF implies CCSM driving to blame. Regional averages in this and subsequent figs. taken over areas defined in Fig. 2. Precipitation (p): Simulation Design: “WRF (accumulated)” computed by subtracting end-of-month jumps from WRF output. • Weather Forecast and Research (WRF) model • version 2.2 • fully compressible, non-hydrostatic, flux form • physics options described in Chin et al. (2008) • 2-way nested domain: • 12 km horizontal spacing for the inner grid • 36 km spacing for the outer grid. • 31 vertical levels; bottom level at 15 m • climate drift prevented by monthly reinitialization • “Mediterranean Climate”: almost all p falls in winter • WRF over predicts in winter, under predicts in summer. • Parameterized p component explains coastal, but not mtn bias Snowpack (SWE): Regional Model: • GCMs don’t resolve mountain peaks, so their snowpack is too low. • Restarting monthly from GCM data keeps SWE too low. • WRF snow fall/melt matches observations. • Community Climate System Model (CCSM) • version 3, Finite-volume dynamical core • resolution = 1º lat x 1.25º lon • Greenhouse gases fixed at 1990 levels Discussion/Directions: GCM: Our results: confirm that dynamical downscaling adds value at regional scales. suggest that model biases may be larger than assumed in previous studies. In the future, we aim to: determine the cause of precipitation bias. improve p, T, and SWE biases in current-climate run. assess Californian climate change with future-climate simulation(s). • Heavy precipitation events are much too strong in WRF. Validation Data: • WRF gets lateral boundary data and sea surface temperature from CCSM • forcing from 6 hourly CCSM outputs (years 300-340) Coupling: UCRL: LLNL-POST_403691 This work performed under the auspices of the U.S. Department of Energy by Lawrence Livermore National Laboratory under Contract DE-AC52-07NA27344.