Download
1 / 25
250 likes | 257 Vues
Measuring the Health Impacts of Air Pollution in Toronto and Hamilton. Murray M. Finkelstein PhD MD Associate Professor, Department of Family Medicine and McMaster Institute of Environment and Health, McMaster U. Department of Family Medicine, University of Toronto.

E N D
Measuring the Health Impacts of Air Pollution in Toronto and Hamilton Murray M. Finkelstein PhD MD • Associate Professor, Department of Family Medicine and McMaster Institute of Environment and Health, McMaster U. • Department of Family Medicine, University of Toronto
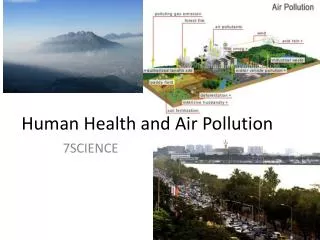
Air Pollution and Human Health • London smog episode demonstrated that extreme air pollution episodes can have adverse effects on health • What about more moderate and usual pollution conditions?
Studies 1990 – PresentTwo Major Designs • 1. Time Series Studies • Look at daily changes in hospitalization or mortality in relation to pollution changes in preceding days • 2. Cohort Studies • Look at long-term mortality of a defined group in relation to pollution levels
Health Outcomes • Feeling Unwell • Emergency Department Visits • Hospitalization • Mortality
Acute 1. Feeling Unwell • Stieb and colleagues used data from the National Population Health Survey to look at Disability Days (sum of days spent in bed or cut down on activities) in 2 week period before NPHS interview in relation to pollution levels in Toronto 1994-1999
Acute 2. Feeling Unwell • Levels of carbon monoxide and particulate matter (PM2.5) were significantly associated with number of disability days. • 30% increase in DDays for 0.2 ppm increase in CO (Mean level in Toronto 1.0) • 20% increase in DDays for 7 microgm/m3 increase in PM2.5 (Mean level in Toronto 11 microgm/m3)
Acute 3. Hospitalization • Burnett et al studied the relation between hospitalization for acute respiratory diseases in children under 2 years of age and warm season levels of ozone in Toronto
Acute 4. Hospitalization • A 35% increase in the daily hospitalization rate for respiratory problems (May–August) was associated with a 45 parts per billion increase in the 5-day average of the daily maximum ozone concentration. • The mean summer average of the ozone level was 45 ppb.
Acute 5. Mortality • Burnett and colleagues reported that Particulate matter and carbon monoxide were also associated with daily mortality in Toronto over the 15-year period 1980 to 1994
Summary of Acute Studies • Studies of short term excursions in air pollution levels in Toronto over the past 20 years find associations with feelings of ill-health, hospitalization for respiratory and cardiovascular diseases, and mortality from cardiopulmonary diseases.
Chronic Urban Exposures • What about long-term exposures in Southern Ontario?
The Hamilton / Toronto Cohort Study • Funded by the Toxic Substances Research Initiative of Health Canada. Study Continuation funded by CIHR. • P.I. Murray Finkelstein McMaster/ U of T and Mike Jerrett , McMaster • Co-investigators: Malcolm Sears, Dave Verma (McMaster) & Ken Chapman (U of T)
The Hamilton / Toronto Cohort Study Subjects • Cohort of 110,000 individuals assembled from respiratory and family medicine clinics in Hamilton and Toronto
Income and Particles in HamiltonSubjects from Firestone Clinic
Traffic Pollution Exposures • Indicator of traffic pollution exposure: Residence within 50m of a major urban road or 100m of a highway
Summary of Chronic Studies in Hamilton and Toronto (I) • There is a non-homogeneous distribution of urban pollution • Poorer neighbourhoods in Hamilton have higher levels of pollutants
Summary of Chronic Studies in Hamilton and Toronto (II) • There is an association between traffic-related pollution in Hamilton and Toronto and increased rates of circulatory disease hospitalization and mortality