Download
1 / 16
160 likes | 170 Vues
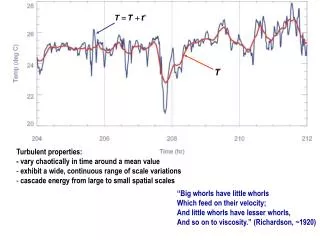
Amplification of the Mean Echo Signal Power of a Coherent Lidar in a Turbulent Atmosphere. V.A. Banakh, A.V. Falits V.E. Zuev Institute of Atmospheric Optics SB RAS Tomsk Russia. Backscatter amplification effect in random media.

E N D
Amplification of the Mean Echo Signal Power of a Coherent Lidar in a Turbulent Atmosphere V.A. Banakh, A.V. Falits V.E. Zuev Institute of Atmospheric Optics SB RAS Tomsk Russia
Backscatter amplification effect in random media M.S. Belen’kii, V.L. Mironov, Soviet Journal of Quantum Electronics,1973 A.G. Vinogradov, Yu.A. Kravtsov, and V.I. Tatarskii, Radiophysics and Quantum Electronics, 1973 V.A. Banakh, V.L. Mironov “Lidar in a turbulent atmosphere”, 1987 is the intensity correlation function of a spherical waveincident on a scatterer is maximal as compared to A.S. Gurvich. Russian Federation Patent No.116245, 2012 I.A. Razenkov, V.A.Banakh, A.I. Nadeev. Russian Federation Patent No.153460, 2015
Two receiver channels (BSA) lidar for estimation of the strength of refractive turbulence Ratio of the mean powers of echo signals in the channels determines the coefficient of backscatter amplification depending on the turbulence strength
Experiment Scheme of the experiment Comparison of temporal variations of the amplification coefficient N and variance of the optical image jitter registered on a probing path . The variance is proportional to the integral value of the Cn2 on a probing path.
Cn2 measured by sonic meteostations 16-17 June 2017. Path 2 km. Amplification coefficient Nmeasured by BSA lidar simultaneously with the sonic meteostations. Cn2 measured by the optical measurer (orange) and sonic meteostations (green and blue). Amplification coefficient (black).
Meteostation 1 100 m Meteostation 2 400 м Coherent Doppler Lidar Screen Stream Line Distance between lidar and screen is 495 м Meteostation 3 100 m Experimental overview
Computer simulation of and for the StreamLine lidar parameters on a 500 m path
Mean power for monostatic and bistatic schemes. Calculations for the StreamLine lidar beam parameters
The structure constant of turbulent fluctuations of the refractive index of air and the signal-to-noise ratio of the Stream Line lidar as functions of time Local time, h: min
SNR versus Cn2 SNR SNR
All experimental data June 2017 Correlation coefficient 0.91 0.71 0.81 0.86 0.51 0.72 SNR
Temporal variations of SNR for StreamLine lidar and amplification coefficient N for BSA lidar
Conclusions Mean power of the echo signal of a coherent lidar can increase in a turbulent atmosphere because of the effect of backscatter amplification in random media On surface paths temporal variations of SNR of a coherent lidar follow to temporal variations of the structure constant of turbulent fluctuations of the air refractive index with high correlation in the most part