Download
1 / 38
400 likes | 775 Vues
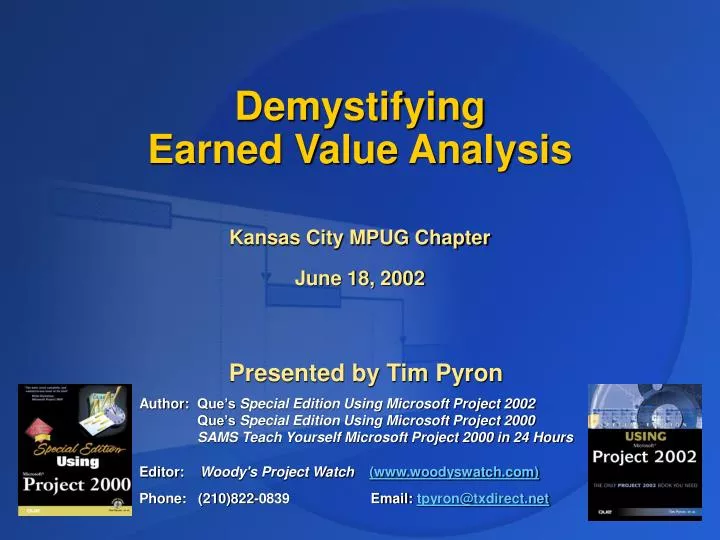
Demystifying Earned Value Analysis. Kansas City MPUG Chapter June 18, 2002. Overview. Understanding Earned Value Analysis Understanding the EV metrics Project’s Earned Value calculations Graphing Earned Value metrics in Excel Conclusion. What is Earned Value Analysis.

E N D
Demystifying Earned Value Analysis Kansas City MPUG Chapter June 18, 2002
Overview • Understanding Earned Value Analysis • Understanding the EV metrics • Project’s Earned Value calculations • Graphing Earned Value metrics in Excel • Conclusion
What is Earned Value Analysis • EVA is the tool used by those who practice Earned Value Management • EVA provides early warning signals of trouble • EVA provides a basis for revising the plan (and maybe the goals) in order to get back on track • EVA provides a basis for estimating final costs and the project finish date.
What’s wrong with using Variances? • Each variance shows a different aspect of progress in its own units; and comparing dollars and time makes it difficult to assess your net position • EVA measures everything in dollars • Variances don’t show if productivity is at the levels you planned • EVA measures productivity up through the status date
History of Earned Value Analysis • Started with defense contracts • Originally used to justify staged payments for projects in progress • Now widespread in private sector also • Is becoming a world-wide standard
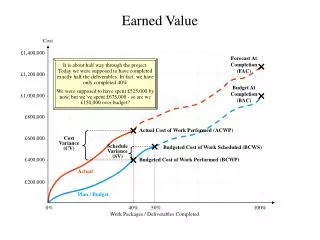
Example: Using variances Baseline duration is 1 Year (Jan – Dec) Baseline cost is $1,000,000 Baseline work is scheduled to be 50% complete as of June 30 Baseline cost through June 30 is $500,000 Actuals on June 30: 60% of work is completed Actual Cost is $550,000 Cost is $1,050,000*Cost = Remaining Cost + Actual Cost What is the Cost Variance? $ 50,000 Does that mean the project will go over budget?That there’s not enough in the budget to finish the project? ??
Example: Using EVA Baseline duration is 1 Year (Jan – Dec) Baseline cost is $1,000,000 Baseline work is scheduled to be 50% complete as of June 30 Baseline cost through June 30 is $500,000 Actuals on June 30: 60% of work is completed Actual Cost is $550,000 Cost is $1,050,000*Cost = Remaining Cost + Actual Cost What is the planned value of this project? $1,000,000 How much of that value has been earned by June 30? $600,000 How much was planned to be earned? $500,000 What did it actually cost ? $550,000
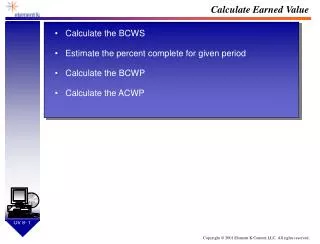
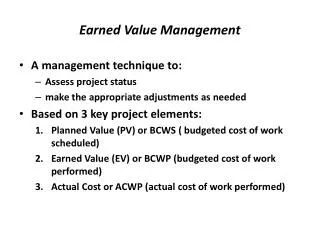
Planned Value (PV) • PV is that part of the project/task’s value we plan to be completed up through the status date. • PMBOK formerly called PV theBudgeted Cost of Work Scheduled orBCWS. • Total Baseline Cost called BAC(Budgeted at Completion)
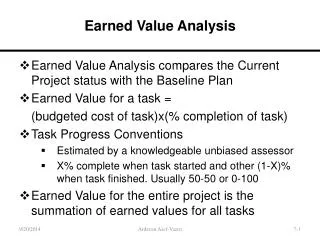
Earned Value (EV) • EV is the planned value of the completed portion of the project/task • EV = % Work Complete * Baseline Cost Note that % Work Complete uses currently scheduled work – not baseline work. Example: Baseline Work = 10h Actual Work = 5 h Scheduled Work = 15h % Work Complete = 33% BAC = $1,000 Earned Value = $333 • PMBOK formerly called EV theBudgeted Cost of Work Performed or BCWP
Actual Costs (AC) • AC is the actual cost of work that was completed as of the status date • PMBOK formerly called this theActual Cost of Work Performed orACWP.
Prerequisites for using EVA • Work and cost must be distributed over time (Microsoft Project’s timephased data) • The must capture the baseline • You must define a Status Date for assessing performance (Project, Project Information) • You must track actual start and finish dates, work, and costs; and you must reschedule work not completed on time and work that is completed ahead of schedule.
The Sample Task Task 1 • Duration = 4 days • Abe is assigned 100% to the task • Abe's standard rate is $1/hr. • Figure 1 illustrates the task and Abe's assignment before any actual work is recorded.
Planned Value and Earned Value • Are equal if everything goes as planned • Both use Baseline Cost for different amounts of work (planned vs actual) • Any difference is due to the amount of work completed by the status date • Differences can arise when (for example): • Estimated work changes after the baseline was captured • Overtime is used but not scheduled (or vice versa) • Resources are diverted to higher priority tasks or projects.
SV: Earned Value Schedule Variance • Equals Earned Value minus Planned Value • SV = Earned Value – Planned ValueSV = BCWP – BCWSTask1: $16 – $24 = - $8 • Positive SV means more work completed than planned. If continued, project may finish early Might be possible to transfer some resources to other tasks or projects • Negative SV means work is not being completed on time. Project might finish late PM should determine the cause to avoid missing the finish goal.
SV%: Schedule Variance Percent • Expresses SV as a % of Planned Value • SV% = SV / PV = (BCWP – BCWS) / BCWSTask1: ( $16 – $24 )/ $24 = – 33%That means 33% of planned work was not finished • SV% is useful when comparing SV between projects of vastly different sizes
SPI: Schedule Performance Index • Most important version of SV • Is ratio of Earned Value to Planned Value SPI = EV / PV = BCWP / BCWSTask1: $16 / $24 = 0.67 • SPI < 1.0 is unfavorable SPI = 0.67 means we earned only $0.67 of every $1 we planned to earn this period • SPI > 1.0 is favorable SPI = 1.25 would mean we earned $1.25 for every $1 we planned to earn during this period.
SPI: Revise Estimated Duration • Use SPI to revise estimated total duration,thus the new estimated finish date • Assumes current SPI will continue to end of project • Revised Remaining Duration (Rem.Dur.) = Remaining Duration / SPITask 1: = 2d / 0.67 = 3d • Finish Date = Status Date + Rem. Duration Task 1: = Day 3 + 3d = Day 6
Earned Value and Actual Costs • Are equal if everything goes as planned • Both use Actual Work, but it’s valued at different costs (planned vs actual) – any difference is due to the cost of the work • Differences can arise when (for example): • Unplanned overtime was used • Resource cost rates changed • Higher cost resources were substituted • Earned Value minus Actual Costs is the Earned Value Cost Variance: CV = EV – AC
CV: Earned Value Cost Variance • CV = Earned Value – Actual Costs • CV = BCWP – ACWPTask 1: $16 – $20 = – $4 • Positive CV is favorable: the value of the work was greater than the cost of producing it. • Negative CV is unfavorable: the value of the work is less than the cost of producing it.
CV%: Cost Variance Percent • Expresses CV as a % of Earned Value • CV% = CV / EV = (BCWP – ACWP) / BCWPTask 1: = ( $16 – $20 ) / $16 = - 25%That means 25% of planned work was not finished • CV% is useful when comparing CV between projects of vastly different sizes
CPI: Cost Performance Index • Most important version of CV • Is ratio of Earned Value to Actual Cost CPI = EV / AC = BCWP / ACWPTask1: $16 / $ 20 = 0.80 • CPI < 1.0 is unfavorable If CPI = 0.80 means for every dollar of actual cost we produce work worth only $0.80 • CPI > 1.0 is favorable IF CPI = 1.25 it would mean that for every $1 we actually spent we produced work worth $1.25 • Use CPI to calculate if project will go over budget and by how much
Estimate to Complete (ETC) • What will it cost to finish the remaining budgeted work (unearned value) assuming the current CPI will continue to the end of the project? • Divideremaining budgeted work by CPI • Remaining budgeted work = BAC - EV*BAC is Budgeted At Completion (Baseline Cost) • ETC = (BAC – EV ) / CPITask 1: ( $32 – $16 ) / 0.80 = $20
Estimate at Completion (EAC) • A revised total cost at completion • EAC = AC + ETCTask 1: $20 + $20 = $40 • Project 2002 now calculates EAC this way • The new Earned Value Cost Indicators table shows EAC, BAC, and VAC (Vac = Variance at Completion)
TCPI: To Complete Performance Index Is there enough left in the budget to complete the project? • (BAC – BCWP) (Budgeted cost of unfinished work) --------------------- = ------------------------------------------------(BAC – ACWP) (Unspent Budget) *where BAC = Baseline Cost • Task1: = ($32 - $16) / ($32 - $20) = 16 / 12 = 1.33 • If TCPI > 1: Not enough in the budget to complete the planned work. Must increase productivity or reduce scope or quality. • If TCPI < 1: Running under budget. Could increase scope or quality, or can increase contract profit
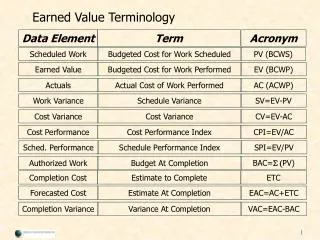
Summary of EV Metrics Three core metrics Planned Value PV (BCWS) Earned Value EV (BCWP) Actual Costs AC (ACWP) Variances Schedule Variance SV = EV-PV; SV% = SV/PV Cost Variance CV = EV-AC; CV% = CV/EV Indicators (performance indexes) Schedule Performance Index SPI = EV/PV Cost Performance Index CPI = EV/AC To Complete Performance Index TCPI = (BAC-EV)/(BAC-AC)
MS Project’s EV Calculation For Assignments:EV = % Work Complete * BAC For Tasks: • Calculate Actual Duration ( = % Complete * Duration) • Sum timephased Baseline Cost for periods spanned by Actual Duration Note: Assignments are not rolled-up to the task. So, Sum of Assignment EV’s <> Task EV
Work around: How to con Project into using % Work Complete • Work with a backup copy of the project file • Choose Tools, Options, Calculation tab: Disable Updating task status updates resource status • Add % Complete and % Work Complete columns to the Earned Value table • Copy % Work Complete column into % Complete column * Assignments still don’t roll up to tasks, but …
Generating EV Graphs • Graphing EV metrics reveals trends over time • Use Analysis Toolbar:Analyze Timescaled Data in Excel • Adjust data and graph formats