Download
1 / 49
500 likes | 656 Vues
C O L O R IMAGE PROCESSING. C O L O R IMAGE PROCESSING. Pseudo-color processing - an assignment of color to an intensity (grey scale) image Full color processing - the enhancement or modification of image acquired with a full color sensor. Color Fundamentals

E N D
COLOR IMAGE PROCESSING
COLOR IMAGE PROCESSING Pseudo-color processing - an assignment of color to an intensity (grey scale) image Full color processing - the enhancement or modification of image acquired with a full color sensor
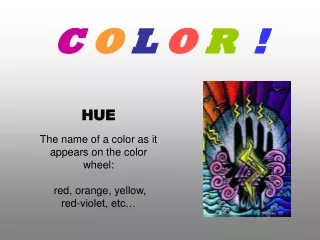
Color Fundamentals Chromatic light - light which exhibits visible color, 400-700 nm Color is perceived when light of a certain wavelength is reflected from the surface of an object and detected by the color sensitive cones in the human eye.
Color Fundamentals Radiance - amount of energy emitted from a light source (watts) Luminance - amount of energy perceived by an observer (lumens) Brightness - subjective notion of achromatic intensity
Subtractive color - Additive color - Color Fundamentals Subtractive color - reflected light Additive color - emitted light
red white green blue Additive Color Mixing additiveprimary colors
red yellow magenta white green blue cyan Additive Color Mixing secondary secondary secondary
Color Perception Color perception is enabled by cones in the retina. Cones contain photosenstive chemicals, called photopigments. There are three types of cones, which are sensitive to wavelengths of light corresponding to the colors red, green and blue. Color is perceived when light of a certain wavelength is reflected from the surface of an object and detected by the color sensitive cones.
Color Display Systems The interior of the screen is composed of an array of electron-sensitive phosphor dots arranged in linear or triangular groups (triads). One dot emits red light when excited by an electron gun. Another emits green light and a third emits blue light excited in the same manner. The nature and arrangement of these triads determines an upper level on the spatial resolution of a displayed image.
Color Models: CIE (Chromaticity Diagram) RGB Cube CYM (CYMK) YIQ HSV HSI CIE (Chromaticity Diagram) RGB Cube CYM (CYMK) YIQ HSV HSI
Color gamut: The color range produced by an RGB monitor Color printing gamut is irregular and more limited CIE (Chromaticity Diagram) X (red) Y(green) Z(blue) = (1-(X+Y))
Color Models: CIE (Chromaticity Diagram) RGB Cube CYM (CYMK) YIQ HSV HSI CIE (Chromaticity Diagram) RGB Cube CYM (CYMK) YIQ HSV HSI
RGB color model (1,1,1) (0,0,0)
RGB color model BLUE (0,0,1) GREEN (0,1,0) RED (1,0,0)
RGB color model CYAN (0,1,1) MAGENTA (1,0,1) YELLOW (1,1,0)
RGB color model shades of grey
FULL COLOR IMAGE RED GREEN BLUE
Color Models: CIE (Chromaticity Diagram) RGB Cube CYM (CYMK) YIQ HSV HSI CIE (Chromaticity Diagram) RGB Cube CYM (CYMK) YIQ HSV HSI
CMY Color Model R G B C M Y 1 1 1 - = Used primarily for color hardcopy generation.
Color Models: CIE (Chromaticity Diagram) RGB Cube CYM (CYMK) YIQ HSV HSI CIE (Chromaticity Diagram) RGB Cube CYM (CYMK) YIQ HSV HSI
YIQ Color Model 0.299 0.587 0.114 0.596 -0.275 -0.321 0.212 -0.523 0.311 R G B Y I Q = Used in commercial color TV broadcasting
YIQ Color Model 0.299 0.587 0.114 0.596 -0.275 -0.321 0.212 -0.523 0.311 R G B Y I Q = Y - luminance - conveys tonal values) I - inphase Q - quadrature convey chrominance information
YIQ Color Model 0.299 0.587 0.114 0.596 -0.275 -0.321 0.212 -0.523 0.311 R G B Y I Q = Inphase and quadrature modulate the chrominance subcarrier. Its amplitude indicates the color’s saturation; its phase indicates hue.
YIQ Color Model 0.299 0.587 0.114 0.596 -0.275 -0.321 0.212 -0.523 0.311 R G B Y I Q = YIQ representation enables intensity transformations to be performed on only the intensity portion of a color image.
FULL COLOR IMAGE RED GREEN BLUE
FULL COLOR IMAGE RED GREEN BLUE (each channel, histogram equalized)
INCORRECT HIST EQUALIZATION FULL COLOR IMAGE
FULL COLOR IMAGE INTENSITY IMAGE
FULL COLOR IMAGE INTENSITY IMAGE INTENSITY HIST EQUALIZATION
FULL COLOR IMAGE INTENSITY IMAGE INTENSITY HIST EQUALIZATION CORRECT HIST EQUALIZATION
YIQ Color Model 0.299 0.587 0.114 0.596 -0.275 -0.321 0.212 -0.523 0.311 R G B Y I Q = R G B 1.0 0.956 0.620 1.0 -0.272 -0.647 1.0 -1.108 1.705 Y I Q =
YIQ Color Model Given a RED pixel: R = 255, G = 0, B = 0 0.299 0.587 0.114 0.596 -0.275 -0.321 0.212 -0.523 0.311 255 0 0 Y I Q = Y = .299(255) + .587(0) + .114(0) = 76.25 ~ 76 I = .596(255) - .275(0) - .321(0) = 151.98 ~ 152 Q = .212(255) - .523(0) + .311(0) = 54.06 ~ 54
YIQ Color Model Given a YIQ value: Y = 76, I = 152, Q = 54 R G B 1.0 0.956 0.620 1.0 -0.272 -0.647 1.0 -1.108 1.705 Y I Q = R = .1.0(76) + .956(152) + .620(54) = 254.79 ~ 255 G = 1.0(76) - .272(152) -.647(54) = -0.282 ~ 0 B = 1.0(76) -1.108(152) + 1.705(54) = -0.346 ~ 0 R = 255, G = 0, B = 0; a RED pixel !
Color Models: CIE (Chromaticity Diagram) RGB Cube CYM (CYMK) YIQ HSV HSI CIE (Chromaticity Diagram) RGB Cube CYM (CYMK) YIQ HSV HSI
HSV Color Model Hue - color attribute that describes pure color Saturation - degree to which pure color is diluted by white light Value - intensity, lightness, brightness (tint, shade and tone for artists)
HSV Color Model Hue, Saturation and Value (tint, shade and tone for artists)
HSV Color Model Hue - an angle around the vertical axis
HSV Color Model Saturation - (color purity) 0 at the center, to 1 on the sides
HSV Color Model Value - ranges from 0 to 1; indicates lightness/darkness
// RGB to HSV conversion // r,g,b values are from 0 to 1 // h = [0,360], s = [0,1], v = [0,1] // if s == 0, then h = -1 (undefined) void RGBtoHSV( float r, float g, float b, float *h, float *s, float *v ) { float min, max, delta; min = MIN( r, g, b ); max = MAX( r, g, b ); *v = max; // v delta = max - min; if( max != 0 ) *s = delta / max; // s else { // r = g = b = 0 // s = 0, v is undefined *s = 0; *h = -1; return; } if( r == max ) *h = ( g - b ) / delta; // between yellow & magenta else if( g == max ) *h = 2 + ( b - r ) / delta; // between cyan & yellow else *h = 4 + ( r - g ) / delta; // between magenta & cyan *h *= 60; // degrees if( *h < 0 ) *h += 360; } *from http://www.cs.rit.edu/~ncs/color/t_convert.html#RGB to HSV & HSV to RGB
Color Models: CIE (Chromaticity Diagram) RGB Cube CYM (CYMK) YIQ HSV HSI CIE (Chromaticity Diagram) RGB Cube CYM (CYMK) YIQ HSV HSI
HSI Color Model ( HUE, SATURATION, INTENSITY ) Hue - angle around vertical axis Saturation - distance from vertical axis Intensity - perpendicular distance from the point corresponding to black
COLOR IMAGE PROCESSING Full color processing - the enhancement or modification of image acquired with a full color sensor Pseudo-color processing - an assignment of color to an intensity (grey scale) image
Image Display Color Palette (LUT) Pixel value (0-255) 0 1 2 5 3 4 255 0 0 5 ... 255 8 bit gray scale