Download
1 / 36
360 likes | 485 Vues
The Polar Atmosphere: Forecasts from weather and climate models. David H. Bromwich Byrd Polar Research Center, The Ohio State University Research Urgencies in the Polar Regions Siena, 23 Sept 2011. Atmospheric changes in the Arctic. Widespread warming of the Arctic:

E N D
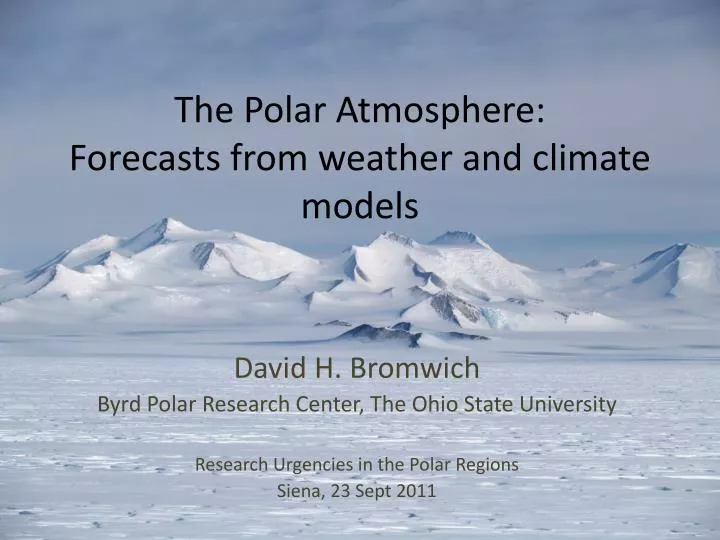
The Polar Atmosphere:Forecasts from weather and climate models David H. Bromwich Byrd Polar Research Center, The Ohio State University Research Urgencies in the Polar Regions Siena, 23 Sept 2011
Atmospheric changes in the Arctic • Widespread warming of the Arctic: • Record temperature and melt extent in Greenland in 2010 [Box et al., Arctic Report Card, 2010] • Lowest (or 2nd-lowest) Arctic sea-ice extent reached on 8-9 Sept. 2011 Ice concentration, 8 Sept. 2011 Greenland melt extent in 2005 University of Bremen (http://www.iup.uni-bremen.de:8084/amsr) http://cires.colorado.edu/science/groups/steffen/greenland/melt2005/
Atmospheric changes in the Antarctic • More regional changes: • Warming in the Antarctic Peninsula and West Antarctica(?) • But lowest Antarctic melt extent in 2008 & 2009 since 1987 [Tedesco & Monaghan, 2009] Melt ponds [Steig et al., 2009] Breakup of the Larsen B Ice Shelf in 2002
Arctic vs Antarctic • Despite being both “polar”, the Arctic and Antarctic exhibit important differences in their climate and exposure to climate warming [Bromwich and Wang, 2008]
Numerical models • Models are used: • to monitor/predict/ understand climate change • for weather guidance • The reliability of these models in polar regions (and elsewhere) depends on: • our understanding of the physical processes • our ability to represent them numerically • the availability of observations to constrain the model Source: NOAA
Numerical Models & time scales Shorter time scales (e.g., days) Longer time scales (e.g., centuries) • Numerical Weather Prediction (NWP) models • Reanalyses (global, regional) • Global Climate Models (GCMs)
Physical processes that need to be optimized for polar regions • Surface energy balance and heat transfer over sea ice and permanent ice surfaces • Variable sea ice thickness and snow thickness over sea ice • Seasonally-varying sea ice albedo • Cloud / radiation interaction • Ice phase microphysics • Turbulence (boundary layer) parameterization
Example: Sea-ice albedo variability May June August Sept. July Images: Courtesy from D. Perovich
Example: Sea-ice albedo variability Observations from the SHEBA experiment (Arctic) [Perovich et al., 2007]
Challenges for NWP in Polar Regions • NWP models generate short-term forecasts based on a known initial state of the atmosphere • The accuracy of the forecasts depends on • the proper representation of physical processes • the amount/distribution of observations used to initialize the forecasts (data assimilation) • Challenge: the sparsity of observations in high latitudes (esp. in Antarctica)
Tropospheric observations for NWP • Limited number of radiosonde observations in high latitudes (the Arctic Ocean and Southern Ocean are virtual data voids) • However, the growing volume of satellite observations used for data assimilation has greatly improved the performance of NWP models in high latitudes • Satellite data assimilation remains challenging over ice-covered surfaces Arctic and Antarctic stations reporting daily radiosoundings in July 2006 Andersson et al., ECMWF Newsletter, 2007
Antarctic AWS network - 2011 • Expansion of the AWS network in Antarctica since the 1990s • Provide observations used for: • data assimilation into NWP models • model evaluation • Challenges: • maintenance of the network • Surface observations only Map from AMRC/UW-Madison (http://amrc.ssec.wisc.edu/)
NWP in the Arctic • NAM: North American Mesoscale Model • 12-km grid, 4-day forecasts • Model: Weather Research and Forecasting (WRF) model • Twice-daily forecasts by the Polar Meteorology Group • 45-km grid, 4-day forecasts; Model: Polar WRF • NWP in the Arctic becoming increasingly important as (if?) economic activities develop in this part of the world NAM “Unfreezing Arctic Assets”, WSJ, 18 Sep. 2010
NWP in the Arcticby the Polar Meteorology Group 2m temperature and sea-level pressure 6h total precipitation Italy USA 24h forecast for 12 UTC 14 Sept 2011 Website: http://polarmet.osu.edu/nwp/?model=arctic_wrf
NWP in the Antarctic • A dedicated effort: The Antarctic MesoscalePrediction Sytem (AMPS) • Support operations of the US Antarctic Program • Model: A polar-optimized version of WRF (Polar WRF) • Grids with resolutions ranging 15km (Antarctica) to 1.6km (McMurdo area) • Forecasts out to 5 days AMPS grids McMurdo www.mmm.ucar.edu/rt/wrf/amps/
AMPS 24-h forecast (00 UTC 15 Sep 2011) Ant. Peninsula domain (resolution: 5km) Antarctic domain (resolution: 20km) Website: www.mmm.ucar.edu/rt/wrf/amps/
Challenges for reanalyses in Polar Regions • A reanalysis uses a state-of-the-art NWP model to retrospectively analyze historic observations (e.g., from 1979 onward) • Challenges: • Global models not “tuned” for high latitudes, (hence the benefits of regional reanalyses) • Sparsity of observations • Impact of changes in the observations (e.g., from satellites)
The Antarctic surface mass balancefrom global reanalyses mm/yr • Figure: Mean annual Antarctic Precip-minus-Evap (P-E) during 1989-2009 from 5 global reanalyses and one observation-based dataset. • The reanalyses show various skills at representing the mean Antarctic climate, which itself is known with great uncertainties Bromwich et al., J. Climate, 2011
Trends in global reanalysesThe Arctic warming ERA-40 NCEP-NCAR JRA-25 • The magnitude of tropospheric temperature trends in the Arctic varies greatly from one reanalysis to the other. • Challenge: produce temporally consistent datasets not affected by changes in the observing system (e.g., satellite observations) and suitable for climate change assessment • Some improvements in the most recent reanalyses thanks to more effective bias correction of satellite radiances DJF MAM JJA SON [Graversen et al., Nature, 2008]
Trends in global reanalysesThe Arctic warming ERA-40 minus ERA-Interim Figures from Screen and Simmonds, J. Climate, 2011
Regional reanalysis:The Arctic System Reanalysis (ASR) • A physically-consistent integration of Arctic and other Northern Hemisphere data. • Mesoscale model: Polar WRF • High resolution in space (10 km) and time (3 hours), convenient for synoptic and mesoscale studies • Begins with years 2000-2010 (Earth Observing System) • Assimilation of a wide range of conventional and satellite observations • Participants: • Ohio State University - Byrd Polar Research Center (BPRC) and Ohio Supercomputer Center (OSC) • National Center for Atmospheric Research (NCAR) • Universities of Colorado and Illinois.
Precipitation yearly total 2007ASR vs ERA-Interim ERA-Int ASR ERA (cm)
Challenges for GCMs in Polar Regions • Benchmarking of GCMs in polar regions • Sparse observations, esp. on multi-decadal scales • Model grid resolution: • IPCC AR4 models: typically 250km horiz. • Ant. Peninsula, Ant. steep coastal slopes: scales < 100km • Parameterizations of subgrid-scale processes • Optimized for lower latitudes • E.g., the atmospheric boundary layer (very stable over snow/ice) • Representation of atmosphere-ocean interactions • Annual cycle of sea-ice cover • Climate modes of variability (e.g., SAM, ENSO)
Benchmarking of IPCC AR4 GCMsExample 1: Antarctic temperatures & P-E • 20th century annual Antarctic temperature trends in the five GCMs are about 2.5-to-5 times larger than observed • Better agreement between the GCMs and observations for snowfall, although the GCMs differ in their ability to reproduce the magnitude/distribution of snowfall • Uncertainties in the observations themselves (reconstructed fields) Observation-based Ensemble Five AR4 GCMS Monaghan et al., GRL, 2008
Mean annual cloud fraction (%) Benchmarking of AR4 GCMsExample 2: Polar clouds • Clouds play an important in the moisture/precipitation and energy budget of the Antarctic Ice Sheet • They are simulated with various skills by GCMs (figure) • Substantial progress has been made recently in our knowledge of the climatology of Antarctic clouds thanks to observations from active satellite sensors (CloudSat-CALIPSO) [Bromwich et al., submitted]
Atmospheric modes of variability(Southern Hemisphere) ENSO teleconnection • The reliability of GCM simulations also depends upon their ability to reproduce the observed modes of atmospheric variability • These modes influence the temperature and moisture advection onto Antarctica El Niño La Niña Southern Annular Mode (aka Antarctic Oscillation) SST composites for El Niño and La Niña conditions [X. Yuan, 2004]
Impact of stratospheric ozone • The projected changes of the SAM depend, in part, on whether the GCMs include ozone forcing (the SAM is also influenced by greenhouse-gas concentrations) • The projected changes in ENSO variability are strongly influenced by the coupling between the atmospheric and ocean models, and highly model-dependent. Figure: Multi-model mean of the regression of the leading EOF of ensemble mean Southern Hemisphere sea level pressure for models with (red) and without (blue) ozone forcing. The thick red line is a 10-year low-pass filtered version of the mean. The grey shading represents the intermodel spread at the 95% confi dence level. [IPCC, 2007]
Atmosphere-ocean interface: Sea ice Sea-ice extent in IPCC AR4 GCMs • AR4 GCMs exhibit a wide range of sea ice extents • Excessive sea-ice cover in CCSM4 is due to anomalously strong zonal winds over the Southern Ocean March September Antarctic sea-ice extent in CCSM4 observations Figure: 1980–1999 sea ice distribution simulated by 14 AOGCMs. For each pixel, the figure indicates the number of models that simulate at least 15% of the area covered by sea ice. The red line shows the observed 15% concentration boundaries. [IPCC, 2007] [Landrum et al., submitted]
Projected temperature and precipitation changes (IPCC, 2007) Future climate change simulated by GCMs must be viewed bearing in mind the limitations of these models Annual surface temperature and precipitation changes between 1980-99 and 2080-99 from the multi-model ensemble A1B projections [IPCC, 2007]
Concluding remarks • Despite substantial progress made in the MODELING of the polar atmosphere, further improvements are still needed in current models, esp. in GCMs. • This effort would/will benefit from the development of an integrated and robust OBSERVING network in both polar regions to: • monitor ongoing changes • help enhance our understanding of the physical processes at play • and provide input for numerical models
Leverett Glacier, Transantarctic Mountains. Photo by Paul Thur.