Download
1 / 51
710 likes | 1.61k Vues
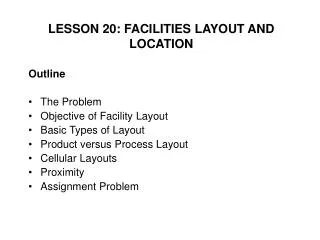
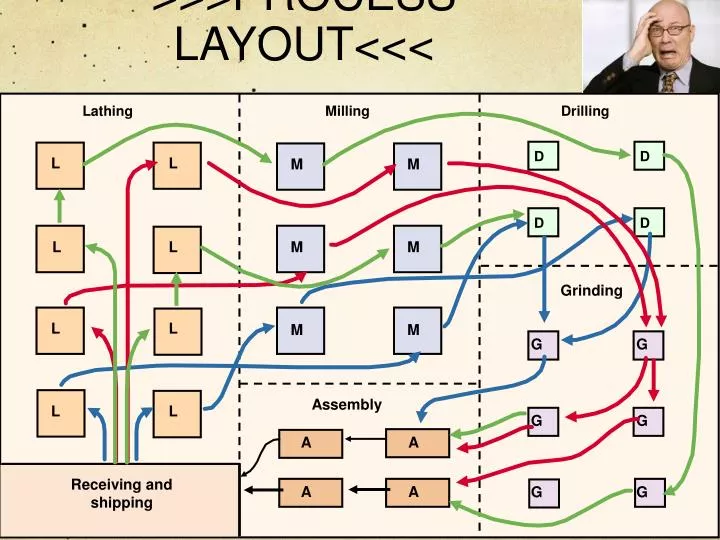
Lathing. Milling. Drilling. D. D. L. L. M. M. D. D. L. L. M. M. Grinding. L. L. M. M. G. G. Assembly. L. L. G. G. A. A. Receiving and shipping . A. A. G. G. >>>PROCESS LAYOUT<<<. Ford Production Plant Layout. Ford-Brazil. What is a “Layout?”.

E N D
Lathing Milling Drilling D D L L M M D D L L M M Grinding L L M M G G Assembly L L G G A A Receiving and shipping A A G G >>>PROCESS LAYOUT<<<
Ford Production Plant Layout Ford-Brazil
What is a “Layout?” • Layout refers to the physical arrangement of economic activity centers for processes within a facility. • A “center” can be anything that consumes space. • The Layout decisions are: • What centers are needed? • How much space and capacity are needed? • Layout Configuration? • Where to locate them?
Strategic Issues • Good layouts improve productivity and efficiency. • Altering a layout can affect an organization and how well it meets its competitive priorities in the following ways: • Increasing customer satisfaction and sales at a retail store. • Facilitating the flow of materials and information • Increasing the efficient utilization of labor and equipment. • Reducing hazards to workers • Improving employee working conditions and morale • Improving communication and interactions
Basic Layouts • Fixed Position • Line-Flow (Product) • Flexible-Flow (Process) • Hybrid • Retail • Warehouse • Office Directly concerned with layout of the transformation process. Not directly concerned with the transformation process.
Qualities of a good layout • Effective & efficient use of space • Facilitates good communication • Minimizes costs • Meets quality of work life needs • noise • safety • lighting • temperature • social • aesthetics We are going arrange activity centers to optimize workflow and time utilization, but this list of intangible factors is also very important and very much affected by the layout.
Flexible Flow Layout Grinding Forging Lathes Painting Welding Drills Milling Office Foundry machines A job shop has a process-focused (flexible-flow) layout. Different jobs have different process requirements and different flow patterns.
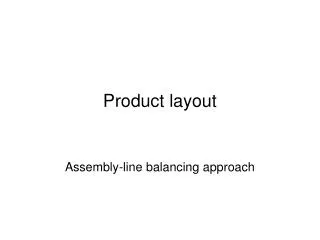
Line-Flow Layout Station 1 Station 2 Station 3 Station 4 A production line has a line-flow layout. Also known as a ‘product-focused’ layout because work (people, workstations, machines) are focused on the product as it moves down the line.
Warehouse/Storage Layouts Objectives: • Optimal utilization of storage space at minimum cost • Minimizing the cost of handling and moving materials and the cost of storing them. Flows are to and from (in and out) of the warehouse rather than in between internal areas. • We try to minimize the # of trips & distances.
Sample Warehouse Problem Trips are monthly round trips to and from the warehouse. (What goes in the warehouse must eventually come out.) There are no one-way trips. Areas are the number of areas assigned to each department.
Sample Warehouse Problem To solve the layout, divide the # of trips each department makes by their number of areas to get trips-per-area. Then prioritize the departments by the # of trips per area. The department with the most number of trips per area gets the closest areas. E G D D A A C Dock B G D D A C F Spaces are assigned closest to the entrance based on priority.
Retail Layout Objectives: • Expose customers to as many products as possible. • Maximize the net profit per square foot of display space.
Fixed Position Layout • Used where the product remains in a fixed position. (Usually large construction such as building a bridge) • Workers & equipment move to and from the product. • Poorest space utilization • Most difficult type of layout to make efficient. • Process is the extreme in Low-volume, High variety. • To make it more efficient, it is usually combined with one or more other types of layouts. (A Hybrid Layout)
Hybrid Layouts to improve Fixed Position • If possible, a line-flow and/or a flexible-flow layout is used along with a fixed-position layout in order to improve efficiency. • Fixed + Line-Flow (Product) • EG: Aircraft parts are made in a line-flow and then delivered to a Fixed-Position location for assembly. • Fixed + Flexible Flow (Process) Layouts • Prefab. Homes are made in a flexible flow layout and then assembled at a Fixed Position Layout.
Flexible-Flow (Process) Layout • Objective: To minimize movement of people, parts, and materials. • Flexible flow is common for low-volume, high-variety processes. • Resources are grouped by function or process. • Typically a variety of products (or customers) move from one area to another depending on what activity is required. (Eg: Students at TCNJ)
Flexible-Flow (process) Layout • Advantages • People & machines can be moved around and used in a variety of ways. (flexible) • Uses general purpose equipment so it is a less capital-intensive process. • Disadvantages • Higher labor skills are needed • Higher inventory levels and inventory-related costs • Higher costs of moving materials since more movement is required to go from process to process. • Longer production (processing) time from start to end • Low utilization of equipment.
Designing Flexible-Flow Layouts • Step 1: Gather information • What are the activity centers (process centers)? • How much space does each activity center need? • Closeness factors: Which centers need to be located close to one another due to frequent interaction. • Closeness matrix (Two-From matrix): A table that shows the degree of interaction between each pair of activity centers or departments. • Step 2: Develop aBlock plan: A plan that indicates the placement of each activity center or department.
The Classic To-From Matrix • Used on maps for the last 100 years
Two types of CLOSENESS (To-From) MATRICIES Values are usually distances between two areas, but could be some other relative measure of closeness such as travel time, steps needed, trips per period of time, etc.
Develop a Block plan • A plan that indicates the placement of each department. Block Plan of Existing Layout Department interactions (Trips per day) B D C F E A To-From Matrices of Department Interactions
Determine the distance between each “interacting” department using rectilinear distance. Dept. Trips Current Total P Multiply trips-per-day times the distance between areas to get total distance traveled. Pair Per-Day Distance Distance A,B 20 3 60 5 A,D 20 2 40 6 A,F 80 2 160 2 Prioritize the department pairs based on total distance traveled. B,C 10 2 20 7 B,E 75 2 150 3 C,D 15 1 15 8 C,F 90 3 270 1 D,E 70 1 70 4 Total distance is used to compare plans. 785 A Euclidean Block Plan of Existing Layout B B D C Rectilinear F E A
1 1 1 3 1 1 1 2 Use a trial-and-error method of selecting a new layout based on the priorities. E D C F A B
Available Decision-Support Tools • Automated layout design program (ALDEP) • A computer software package that constructs a good layout from scratch, adding one department at a time. • Computerized Relative Allocation of Facilities Technique (CRAFT) • A trial-and-error (heuristic) method that begins with the closeness matrix and an initial block layout, and makesa series of paired exchanges of departments to finda better block plan. (No need to memorize these tools for the exam. Just be aware that software exists for solving these types of layout problems.)
More Hybrids • In addition to the common fixed-position hybrids that combine flexible flow and/or line flow with a fixed position situation, there are other hybrids that have characteristics of both a flexible-flow and a line-flow. • One-Worker, Multiple-Machines (OWMM) cell is a one-person cell in which a worker operates several different machines simultaneously to achieve a line flow at that particular workstation.
Machine 2 Machine 3 Machine 1 Materials in Finished goods out Machine 4 Machine 5 One Worker, Multiple Machines
Group Technology • A Hybrid Layout technique used to make flexible flows more like line flows. • A low-volume, flexible-flow process that contains multiple line-flows. (One-Worker, Many Machines is a mini line flow) • Parts/products that have similar processing requirements are grouped into line flows. • Material Inventory is reduced • Work-in-process Inventory is reduced • Work flow is simplified • Floor space is optimized
Before Group Technology Lathing Milling Drilling D D L L M M D D L L M M Grinding L L M M G G Assembly L L G G A A Receiving and shipping A A G G Jumbled flows in a job shop without using Group Technology cells.
After applying Group Technology M L L G Assembly area D A A Cell 2 Cell 1 L M Receiving G G Cell 3 M L D Shipping Line flows in a job shop with three GT cells. Each of three types of jobs go through their required functional processes in a linear flow.
Office Layouts • People problems dominate office layouts. • Most procedures for designing office layouts try to group workers whose jobs require frequent interaction. • Privacy is another key factor in office design. • Three basic types of office layouts: • Traditional (Private offices such as for faculty in the School of Business and for attorneys in a law firm) • Office Landscaping (cubicles) • Activity Settings (Gym, Library) Where workers move from area to area depending on the type of work they need to do.
Objective: To have a work-balanced line! Minimize the number of workers/work stations on a production line, and give them equal (balanced) work loads Two types of line flows that can be balanced… Line-Flow (Product) Layouts Cutting, milling, machining, drilling, etc. Assembling partsand components Note: Waiting lines cannot be balanced because there is no work being done in the line.
Station 1 Station 2 Station 3 Station 4 Line Balancing • The work that one person or one machine does should be balanced (in terms of time) with the work that another person or machine does on that line. • Imbalanced lines are inefficient. • Some people or machines are idle while others are working. • Idleness is wasteful • Unions and workers don’t tolerate unequal work loads.
Work Elements • A work element is the smallest unit of work that can be done independently by one worker or one machine. • An element may one worker operating many machines (OWMM). • The goal in line balancing is to combine work elements into work stations so that each workstation has the same work load. (Or approximately the same work load.) • A workstation may be one work element or many work elements. • The minimum number of workstations necessary for each line flow must be calculated.
Immediate Predecessors • The work element or elements that must be completed immediately before the next element can begin. • Similar to precedent activities in project management • A diagram of work elements and their relationships is called a Precedence Diagram. (Similar to Project Management) • Work elements are denoted by nodes (circles or squares), and contain the time required to perform that work.
Precedence Table A precedence table lists all of the work elements and the immediate predecessors, if any, of each element.
Precedence Diagram D 25 B 80 C 30 E 20 A 40 J 115 G 120 F 15 I 130 H 145
Line Balancing Terms • WORK STATION: • A work station is a grouping of one or more work elements. • CYCLE TIME: • Cycle time is the maximum time allowed for a workstation to complete its work on a given product/service before passing it on to the next workstation. • Exceeding the cycle time at any workstation means the day’s production quota won’t be met. • NOTE: Cycle time is NOT the time it takes to do the work-elements at a workstation, but the maximum time a workstation is allocated to complete its work.
Desired Output Rate • This is the target production output (quota) for a given period of time. (Units of output per shift or per day, etc.) • If the cycle time (maximum time) is exceeded at any workstation, the desired output (quota) for the shift cannot be achieved. • Line balancing focuses on combining work elements into equally-balanced workstationsso as to best meet the desired output.
Desired Output = 192 per 8 hr shift Computing the Cycle Time • Cycle time is the maximum time a workstation can spend working on one widget and still meet the desired output. • Cycle time is how how much time is allocated to make one widget, given a desired output rate (quota) and time period. • If we wish to make 192 units in an 8-hour shift, how long do we have to make one widget? (192 widgets/8 hours) • 8 hours = 28,800 seconds • 28,800 seconds / 192= 150 seconds to make each widget. • Cycle Time (C) = 150 seconds
Desired Output = 192 per 8 hr shiftCycle Time = 150 Theoretical Minimum # of Workstations What is the Minimum # of Workstations needed to achieve the desired output? • A perfectly balanced line would have the necessary minimum # of workstations, each having the same work load. • Add up the total time for all work elements and divided it by the maximum time allowed to make one widget. (Cycle Time) 720 / 150 = 4.8 work stations Theoretical Minimum # of workstations =the sum of all work stationsdivided by the cycle time Round up to 5 work stations.
Desired Output = 192 per 8 hr. shift • Cycle Time = 150 • Min. Work Stations = 5 Balance Delay • The theoretical # of workstations is 4.8, but the actual number of workstations has to be 5. • Thus the line will not be 100% efficient. • In most situations it is impossible to have a 100% balanced line. • In a balanced line, no one is waiting for anyone else. • Balance delay is the amount (%) you fall short of 100% efficiency. (There is some idleness.) • A 90% efficient line would have a 10% balance delay.
Desired Output = 192 per 8 hr shiftCycle Time = 150Minimum # workstations = 5 Computing Efficiency The theoretical number of workstations is 4.8 We had to round that up to 5.0 workstations. 4.8 is 96% of 5 (4.8 / 5 = .96) Thus our system is 96% efficient. (4% Balance Delay) (4% of the time someone is idle.)
Establishing Workstations Group the 10 work elements into five workstations, with each as close to the 150 second cycle time as possible. D 25 B 80 C 30 E 20 A 40 J 115 G 120 F 15 I 130 Start with the work element that has the highest time and work down. In this example, there are no constraints for grouping work elements. In the real world, there would be many more elements and many constraints. H 145
Another line balancing example:Green Grass, Inc. Green Grass, Inc., a manufacturer of lawn & garden equipment, is designing an assembly line to produce a new type of fertilizer spreader. Using the following information, construct a precedence diagram it’s assembly.
D H 40 B 20 30 E 6 A F 40 C 25 50 I 18 G 15 © 2007 Pearson Education Desired output is 2,400 units per 40-hour week or 60 units per hour. Line Balancing Green Grass, Inc. If you have to make 60 per hour, that is one ever minute. Cycle time = 1 min. or 60 seconds Minimum # workstations is then 244 seconds divided by the cycle time. 244/60 = 4.067 workstations. Round up to 5 workstations
Desired Output is 60 units per hour. Cycle Time is 60 seconds per unit. Minimum Workstations is 5 Efficiency (%) = the theoretical # of workstations / actual # of workstations = 4.067 / 5 = .813 or 81.3% Idle timeis the total unproductive time for all stations in the assembly of each unit. This is also called Balance Delay. Balance Delay is the amount by which efficiency falls short of 100%. (100% - 81.3%) = 18.7%
D H 40 B 20 30 E S1 S3 6 S4 A S2 S5 F 40 C 25 50 I 18 G 15 © 2007 Pearson Education Line Balancing Green Grass, Inc. The goal is to cluster the work elements into 5 workstationsso that the number of work-stations is minimized, and the cycle time (c) of 60 secondsis not violated. Here we use the trial-and-error method to find a solution, although commercial software packages are also available. c = 60 seconds/unit TM = 5 stations Efficiency = 81.3%
Four Homework Problems(Due in one week)(No computer use is needed) #1. Solve the warehouse layout below.
Homework Problem # 2 The closeness matrix below shows the daily trips between six department offices. The block diagram shown is one solution being proposed. 1. Just looking at the matrix, which two offices should be located closest? 2. What is the total weighted-distance for the proposed layout? 3.Can you find a better layout?
Homework Problem # 3: Line Balancing Draw the precedence diagram for following situation. Using a desired output of 40 units per hour, calculate the following: • Cycle Time • Theoretical Minimum • System Idle Time • Efficiency • Balance Delay • Group the work elements into the Theoretical Minimum # of work stations.