Download

1 / 195
1.95k likes | 2.08k Vues
( و قضى ربك ألا تعبدوا إلا إياه وبالوالدين إحسانا إما يبلغن عندك الكبر أحدهما أو كلاهما فلا تقل لهما أف ولا تنهرهما وقل لهما قولاً كريما* واخفض لهما جناح الذل من الرحمة وقل رب ارحمهما كما ربيانى صغيراً*). Contribution for the analysis of certain drugs which treat cerebrovascular insufficiency.

E N D
(و قضى ربك ألا تعبدوا إلا إياه وبالوالدين إحسانا إما يبلغن عندك الكبر أحدهما أو كلاهما فلا تقل لهما أف ولا تنهرهما وقل لهما قولاً كريما* واخفض لهما جناح الذل من الرحمة وقل رب ارحمهما كما ربيانى صغيراً*)
Contribution for the analysis of certain drugs which treat cerebrovascular insufficiency
This thesis consists of six parts • Part I: General introduction • Part II: New spectrophotometric method for simultaneous determination of binary mixtures of nicergoline and cinnarizine and stability indicating for vincamine. • Part III: Simultaneous determination of nicergoline and cinnarizine. • Part IV: Stability indicating methods for the determination of meclophenoxate hydrochloride. • Part V: Stability indicating methods for the determination of vinpocetine. • Part VI: Stability indicating methods for the determination of Pyritinol dihydrochloride.
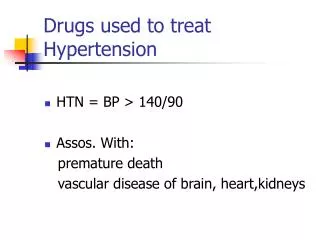
Part IGeneral introduction • Types of cerebrovascular disease • Cerebrovascular insufficiency Etiology and Pathophysiology • Complications of cerebrovascular insufficiency • Mechanism of action of the selected drugs
Part II New spectrophotometric method for simultaneous determination of binary mixtures of nicergoline and cinnarizine and stability indicating for vincamine
This part includes a general introduction about the chemistry of nicergoline, cinnarizine and vincamine. • Review article on the reported methods used for their quantitative determination. • This part is subdivided into two sections: • Section(A): Determination of vincamine in presence of its acid degradation product by the ratio subtraction method • Section(B): Determination of nicergoline and cinnarizine by the ratio subtraction and isosbestic point methods
Section(A) Determination of vincamine in presence of its acid degradation product by the ratio subtraction method
Theory of ratio subtraction method: The method depends on that, if you have a mixture of two drugs (X) and (Y) with overlapping spectra and the spectrum of (Y) is extended than (X), the determination of (X) can be done by dividing the spectrum of the mixture by a certain concentration of (Y) as a devisor (Y'). The division will give a new curve that represents .If we subtract this constant, then multiply the new curve obtained after subtraction by (Y') (the devisor), therefore we can obtain the original curve of (X). This can be summarized as follows: The constant can be determined directly from the curve by the straight line which is parallel to the wavelength axis in the region where (Y) is extended.
268nm Figure (2): Absorption spectra of vincamine 20 µg ml-1 (———) degradation product 20 µg ml-1 (---------- ) and deg.product 16 µg ml-1 (devisor) (———) using 0.1N hydrochloric acid as a solvent.
A (X+Y/Y’) Figure (5): Division spectra of laboratory prepared mixtures of vincamine (X) and its degradation product (Y) using 16 µg ml-1 of degradation product (Y') as a divisor and 0.1 N HCl as a solvent.
A (X/Y') Figure (6): Division spectra of laboratory prepared mixtures of vincamine (X) and its degradation product (Y) using 16 µg ml-1 of degradation product (Y') as a divisor and 0.1 N HCl as a solvent after subtraction of the constant.
A (X/Y’*Y’ = X) 268nm 268nm Figure (7): The obtained absorption spectra of vincamine in lab.mixtures 8-32 g.ml-1 Figure (7): The original absorption spectra of vincamine in cal.curve from 8-40 g.ml-1
Absorbance Figure (4): Linearity of the absorbance of the zero order curve at 268.2 nm to the corresponding concentration of vincamine.
Table (I): Determination of vincamine in laboratory prepared mixtures by the proposed method.
Table (II): Determination of vincamine in oxybral capsules by the proposed method. * Stability indicating spectrophotometric method. ** Spectrophotometric method
Table (III): Application of standard addition for the determination of vincamine by the proposed method.
Table (IV): Statistical comparison for the results obtained by the proposed method and the reported method for the analysis of vincamine in pure powder form * Stability indicatingspectrophotometric method. The figures in parenthesis are the corresponding tabulated values at P=0.05
Section [B] Determination of nicergoline and cinnarizine by the ratio subtraction and isosbestic point methods
Structure of nicergoline: • Structure of cinnarizine:
235.8 nm 270.2 nm Figure (9): Absorption spectra of Nicergoline 20 µg ml-1 (———) Cinnarizine 20 µg ml-1 (------------- ) and mixture of 10 µg ml-1 of each drug (……….) using methanol as a solvent.
Figure (10): Zero order absorption spectra of nicergoline 6- 36 μg ml-1
Absorbance Absorbance Figure (13): Linearity of the absorbance of the zero order curve at 235.8 nm to the corresponding concentration of nicergoline Figure (12): Linearity of the absorbance of the zero order curve at 270.2 nm to the corresponding concentration of nicergoline.
A (X+Y/Y’) Figure (15): Division spectra of laboratory prepared mixtures of cinnarizine (X) and nicergoilne (Y) using 6 µg ml-1 of nicergoline (Y') as a divisor and methanol as a solvent. (Scale x 0.1)
A (X/Y') Figure (16): Division spectra of cinnarizine (X) and nicergoilne (Y) using 6 µg ml-1 of nicergoline (Y') as a divisor and methanol as a solvent after subtraction of the constant.(scale x 0.1)
252nm A (X/Y‘*Y’ = X) Figure (17): The obtained absorption spectra of cinnarizine in lab.mixtures. Figure (17): The original absorption spectra of cinnarizine in cal.curve.
Absorbance Figure (14): Linearity of the absorbance of the zero order curve at 252.0 nm to the corresponding concentration of cinnarizine.
Table (V): Determination of nicergoline and cinnarizine in laboratory prepared mixtures by the proposed methods
Table (VI): Determination nicergoline and cinnarizine in cinibral tablets by the proposed method. * HPLC method.
Table (VII): Application of standard addition for the determination of nicergoline and cinnarizine by the proposed method. * Average of four determinations.
Table (VIII): Statistical comparison for the results obtained by the proposed method and the reported method for the analysis of nicergoline and cinnarizine in pure powder form * HPLC method. The figures in parenthesis are the corresponding tabulated values at P=0.05
Table IX: Assay parameters and method validation RSD %a, RSD %b the intra-day, inter-day respectively (n=5) relative standard deviation of concentrations (28, 32 µg/ml) for vincamine, (6, 8 µg/ml) for nicergoline and (14, 16 µg/ml) for cinnarizine..
Part III Simultaneous determination of nicergoline and cinnarizine in their binary mixture
This part is subdivided into four sections: • Section [A]:Simultaneous determination of nicergoline and cinnarizine by the derivative spectrophotometry • Section [B]: Simultaneous determination of nicergoline and cinnarizine by densitometric methods • Section [C]: Simultaneous determination of nicergoline and cinnarizine by high-performance liquid chromatography • Section [D]: Simultaneous determination of nicergoline and cinnarizine by chemometric methods
Section [A] Simultaneous determination of nicergoline and cinnarizine by the derivative spectrophotometry
Figure (67): Absorption spectra of Nicergoline 22 µg ml-1 (———) and Cinnarizine 12 µg ml-1 (---------- ) using methanol as a solvent.
dA/dλ 307nm Figure (68): First order spectra of Nicergoline 22 μg ml-1 (______) Cinnarizine 12 μg ml-1 (_ _ _ _ _ _) using methanol as a solvent.
dA/dλ 307nm Figure (69): First – derivative absorption spectra of 6 - 38 µg ml-1 nicergoline.
Figure (70): Linearity of the peak amplitude of the first derivative at 307.6 nm to the corresponding concentration of nicergoline.
A (cinnarizine/nicergoline) Figure (71): Zero order of ratio spectra of cinnarizine 6- 22 μg ml-1 using 10 µg ml-1 of nicergoline as a divisor.
244nm dA(cinnarizine/nicergoline)/dλ Figure (72): First order of ratio spectra of cinnarizine 6- 22 μg ml-1 using 10 µg ml-1 of nicergoline as a divisor.
Figure (73): Linearity of the peak amplitude of the first derivative of the ratio spectra at 244.6 nm to the corresponding concentration of cinnarizine.
Table (LXIII): Simultaneous determination of nicergoline and cinnarizinee in laboratory prepared mixtures by the proposed methods.
Table (LXIV): Determination of nicergoline and cinnarizine in cinibral tablets by the proposed methods. * HPLC method.
Table (LXV): Application of standard addition for the determination of nicergoline and cinnarizine by the proposed method. * Average of four determinations.
Table (LXVI): Statistical comparison for the results obtained by the proposed method and the reported method for the analysis of nicergoline andcinnarizine in pure powder form * HPLC method. The figures in parenthesis are the corresponding tabulated values at P=0.05
Section [B] Simultaneous determination of nicergoline and cinnarizine by densitometric methods
Figure (74): TLC chromatogram of nicergoline and cinnarizine A= nicergoline, Rf= 0.505. B= cinnarizine, Rf = 0.807. M= mixture of both drugs Developing system, chloroform : methanol : ethyl acetate(5: 3 :2 v/v/v)
Reflectance Reflectance Distance (mm) Distance (mm) Figure (76): Scanning profile of the TLC chromatogram of cinnarizine at 252 nm. Figure (75): Scanning profile of the TLC chromatogram of nicergoline at 287 nm.
spot-1 Figure (77): Linearity of the area under the peak to the corresponding concentration of nicergoline Figure (78): Linearity of the area under the peak to the corresponding concentration of cinnarizine