Download
1 / 31
330 likes | 594 Vues
Automatic Correction of Saturated Regions in Photographs using Cross-Channel Correlation. Syed Zain Masood, Jiejie Zhu & Marshall F. Tappen. University of Central Florida (UCF) Orlando, FL, USA. Introduction. What is Saturation ? Caused by over-exposure

E N D
Automatic Correction of Saturated Regions in Photographs using Cross-Channel Correlation Syed Zain Masood, Jiejie Zhu & Marshall F. Tappen University of Central Florida (UCF) Orlando, FL, USA
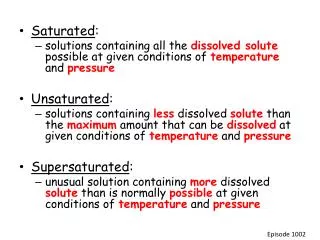
Introduction • What is Saturation ? • Caused by over-exposure • Sensor incorrectly responds at its maximum value • Incorrect camera exposure settings main cause of saturation • Undesirable artifacts
Saturation-free Image • Example De-saturated Saturated
Motivation • Motivation • Causes loss of data • Visually unpleasant • Recapturing not always a solution
Color Channel Saturation • For most cases, only 1 or 2 channels are saturated Green Red Blue
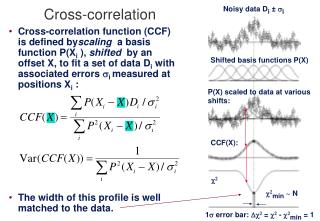
Images are locally smooth except across edges Smoothness Constraint
Cross-Channel Ratios • Cross-channel ratios are locally smooth 1-pixel vertical shift 3-pixel horizontal shift 5-pixel diagonal shift
Fundamentals • Estimate cross-channel ratios using smoothness prior. • Use cross-channel correlation plus smoothness constraint in recovering true color values for saturated pixels.
Recovery Method • Two step method • Step 1: Recover cross-channel ratios • Estimate the color channel ratios for saturated pixels • Step 2: Recover color channel values • Using the true cross-channel ratios calculated in step 1, estimate the correct responses for saturated color channels
Step 1: Estimating Cross-Channel Ratios • Recovering cross-channel ratios • Saturated color channel ratio estimated using local smoothness constraint. • Unsaturated color channel ratio close to observed • Quadratic cost function used • Solution obtained using classical energy minimization method
Step 1: Constraints • Smoothness constraint for estimating ratios involving saturated channels • Ratio between unsaturated channels close to observed Weight function (Similar to Levin’s Colorization) • Constraints Color Channel Ratio e.g. Red/Green Original Color Channel Ratio e.g. Red/Green
Weight function (Similar to Levin’s Colorization) 0 if pixel ‘p’ saturated, 1 otherwise Estimated Color Channel ratio at pixel ‘p’ Observed Color Channel ratio at pixel ‘p’ Estimated Color Channel ratio at pixel ‘q’ Step 1: Cost Function • Cost function:
Step 1: Example • Example • Red:Green ratio Saturated ratio Ground Truth ratio Recovered ratio
Step 2: Estimating Color Values • Estimating Color Values • Partially Saturated Pixels: Cross-channel ratios used to estimate color values • Totally Saturated Pixels: Estimated using the local smoothness constraint • Unsaturated color values close to observed • Quadratic cost function used • Solution obtained using classical energy minimization • For simplicity, recovery of Red channel shown.
Observed Red value at pixel ‘p’ Step 2: Constraints • Constraints • Partially Saturated: Values estimated using cross-channel ratios • Totally Saturated: Est. using local smoothness • Unsaturated values close to observed Red:Green at pixel ‘p’ Red:Blue at pixel ‘p’
Color ratio Red:Green at pixel ‘p’ Color ratio Red:Blue at pixel ‘p’ Observed Red value at pixel ‘p’ ‘1’ if at pixel ‘p’: Red is saturated Green is unsaturated ‘1’ if at pixel ‘p’: Red is saturated Blue is unsaturated ‘1’ if at pixel ‘p’: Red is unsaturated ‘1’ if at pixel ‘p’: All channels saturated Step 2: Cost Function • Cost function: Red value at pixel ‘q’ in N(p)
Experiments & Results • System evaluated both quantitatively and qualitatively • Comparison against pixel-wise scaling and Levin’s colorization demonstrated. • 3x3 neighborhood window used • Image size typically 500x400 or less • Matlab built-in least square solver used
Limitations • Handling totally saturated pixels in a significant portion of the image
Quantitative Analysis • Auto-exposure bracketing feature in modern SLR cameras used • Obtained two identical images with different exposure settings • The brighter image is saturated while the darker is the ground truth
Quantitative Analysis Saturated image Ground truth image Recovered image
Quantitative Analysis Comparison of saturated region (forehead) Quantitative comparison
Comparison with Baseline Methods • Baseline Methods • Pixel-wise non-linearity • Levin’s Colorization • We would show that comparable saturation-free results cannot be achieved by the above techniques.
Comparison: Pixel-wise Non-linearity Pixel-wise non-linearity Our method Saturated image
Comparison: Levin’s Colorization Colorization Our method Saturated image
Results Saturated De-saturated
Results Saturated De-saturated
Results Saturated De-saturated
Results Saturated De-saturated
Results Saturated De-saturated