Download

1 / 34
340 likes | 631 Vues
Three Factor to Four Factor to Five Factor Machines. Ted Mitchell. We Have Expanded Two-Factor Demand Models, Q. Into Three-Factor Models Cups sold, Q = (Cups per hour) x hours, H Cups sold, Q = ( Factor 1 , Q/H) x ( Factor 2 , H) Into

E N D
Three Factor to Four Factor to Five Factor Machines Ted Mitchell
We Have Expanded Two-Factor Demand Models, Q • Into Three-Factor Models • Cups sold, Q = (Cups per hour) x hours, HCups sold, Q = (Factor 1, Q/H) x (Factor 2, H)Into • Cups sold, Q =(cups per server) x (servers per hour) x Hours • Cups Sold, Q = (Factor 1, Q/S) x (Factor 2, S/H) x (Factor 3, H)
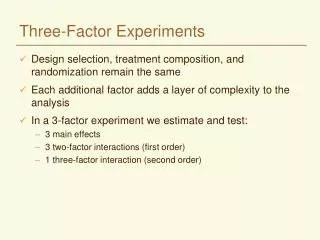
We have recognized that Demand, Q • Is NOT the only output of marketing machines • Other Outputs Include: • Revenue = Price x Quantity sold • Gross Profit = (Profit per unit) x Quantity sold • Marketing Profit = Gross Profit–Direct Fixed Marketing Expenses • Awareness • Satisfaction • Market Share
Other Two-Factor Models can be expanded as well • 1) Output: Dollars of Sales Revenue, R Revenue, R = (dollar sales per server) x (servers per hour) x number of hoursR = (R/S) x (S/R) x H • 2) Output: Dollars of Gross Profit, GGross Profit, G = (gross profit per server) x (servers per hour) x (number of hours, H)G = (G/S) x (S/H) x H
Consider a Three-Factor Revenue Machine • Revenue, R = (dollar sales per server) x (servers per hour) x (number of hours)R=(Factor 1, R/S)x (Factor 2, S/H)x Factor 3, H) • R = (R/S) (S/H) (H) • It might be useful to expand this Three Factor Revenue Machine to explicitly include the demand or the quantity sold, Q,
The process has three stages • 1) Expand the given model with the variable that is to be made explicit • 2) Aggregate the conversion rate ratios to include the new variable • 3) Decompose the aggregated conversion rate into multiple conversion rates that include the newly explicit variable
Stage 1: Expand • Identify the machine to be expandedRevenue, R = (R/S) x (S/H) x Hours, H • Insert the variable to be made explicit as Unity • (Quantity sold, Q)/(Quantity sold, Q) = Q/Q = 1 • Revenue, R = (R/S) x (S/H) x 1 x Hours, H • Revenue, R = (R/S) x (S/H) x (Q/Q) x Hours, H
Stage 2: Aggregate • The conversion rates • Revenue, R = (R/S) x (S/H) x (Q/Q) x Hours, H • Revenue, R = (RSQ/SHQ) x Hours, H • Conversion rate, r = (RSQ/SHQ) Ugly massive conversion factor
Stage 3: Decompose • The ugly aggregated conversion rate • Revenue, R = (RSQ/SHQ) x Hours, H • Revenue, R = (R/Q) x (Q/S) x (S/H) x Hours, H • whereR/Q = Factor #1 = Revenue per cup (Price) • Q/S = Factor #2 = Cups per server • S/H = Factor #3 = Servers per hour • H = Factor #4 = Input: Operating Hours
Moved from a Three-Factor Demand Machine to a Four-Factor Revenue Machine • Three-Factor Machine with an Output of Demand, Quantity Sold • Quantity Sold, Q = (Cups per server) x (Servers per hour) x Hours, HQuantity Sold, Q = (Q/S) x (S/H) x HInto • Four-Factor Revenue Machine
A Four-Factor Model of Revenue • Revenue, R = (Price, P) x (Q/S) x (S/H) x H • Revenue , R = selling price x cups per server x servers per hour x operating hours • A difference in selling price, ∆P, might help explain some difference in the output of two marketing performances
Creating a Multi-Factor model of the marketing machine • With good explanatory power • Is the first step in comparing one marketing performance to an average performance, to a previous performance, to a target or benchmark performance, to a competitor’s performance. • You need to have an impact analysis to measure the size of differences in the two performances • Impact analysis is the second step
Three things changing resulting in a change in Revenue, ∆R, being produced • 1) The number of hours, H, is different • H1 = 112 hours, H2 = 100 hour • 2) The number of servers, S, is different • S1 = 18 servers, S2 = 20 servers • 3) The quantity sold is different • Q1 = 2,200 cups, Q2 = 2,400
Our focus is on the changing ratios • Of the conversion rates Not the changes in variables • Number of serversper hour (S/H) is different • (S/H)1= 16 servers per 100 hours, (S/H)2= 20 servers per 100 hours • (S/H)1 = 0.16 sph, (S/H)2 = 0.2 sph • The quantity sold per server (Q/S)is different • (Q/S)1= 122.2 qps, (Q/S)2= 120 qps • Revenue per cup or selling price is different • P1 = $4.00 per cup, P2 = $3.80 per cup
From the report we conclude • 1) the most important impact to explain differences in the revenues was • Not the Change in Price (average revenue per cup) • Not the Change in Hours • Yes! Was Change In Number of Servers • 2) A 12 hour difference in operating time was more important than the 20¢ difference in price
The more strategic • The Two-Factor Model the greater the opportunity to find significantly important marketing variables to make explicit in the Machine • A Tactical Machine would be • Quantity sold, Q = (Cups per hour) x Hours • A Strategic Machine would be • Gross Profit, G = (Profit per Hour) x Hours
How about a 5 Factor Model? • We identified the possibility of a three factor model to explain Gross Profit, G • Gross Profit, G = (gross profit per server) x (servers per hour) x Hours, H • Gross Profit, G= (G/S) x (S/H) x H • We want to make both Revenue, R, and Quantity Sold, Q, explicit in the model
For a 5 Factor Model • Move from a 3-Factor Model of Gross Profit, G, to a 5-Factor Model • Gross profit, G = (G/S) x (S/H) x H • We insert Revenue, R, and Quantity sold, Q, As unity or (Q/Q) = 1 and (R/R) = 1 • Gross profit, G= (G/S) x (S/H) x 1 x 1 x H • Gross profit, G= (G/S)x(S/H)x (Q/Q) x (R/R) x H
Step 2: Aggregate the conversion rates • Gross profit, G= (G/S)x(S/H)x (Q/Q) x (R/R) x H • Gross profit, G= (GQRS)/SHQR) x H • We have a very large and ugly conversion factor
Step 3: Decompose the large ugly conversion rates • Gross profit, G= (GQRS)/SHQR) x H • Decompose the large ugly conversion factor • Gross Profit, G= (G/R) x (R/Q)x (Q/S) x (S/H) x H • where • G/R = Factor #1 = Gross Return on Sales or Markup on Price, Mp • R/Q = Factor #2 = Revenue per Cup = Price per Cup • Q/S = Factor #3 = Cups Sold per Server • S/H = Factor #4 = Servers per hour • H = Input Factor #5 = Number of Operating Hours
There are thousands of combinations • that the big ugly aggregated conversion factor can be decomposed into • There is an art to decomposition of the big ugly conversion rate into a series of conversion rates that resonate with managers and make sense to executives
A Five Factor Model explaining • Differences in Gross Profit, ∆G = G2-G1 • Due to the differences between the 5-Factors of two different performances • 1) Markup on Price, (P-V)/P • 2) Selling Price, R/Q = P • 3) Cups sold per server, Q/S • 4) Servers working per hour, S/H • 5) Number of hours open, H Could be Very Useful for Diagnostic purposes
For Example, Selling Coffee • Input and Moderating Factors • Hours of Operation = 112 hours • Number of Servers = 18 servers • Cups sold = 2,200 cups • Revenue = $8,800 • Output: Gross Profit = $7,920
For Example, Selling Coffee • Benchmark performance • Input and Moderating Factors • Hours of Operation = 100 hours • Number of Servers = 20 servers • Cups sold = 2,400 cups • Revenue = $9,120 • Output: Gross Profit = $8,390
Impact Analysis is still used to explain the difference in the output of the two performances, ∆G = $470
It is obvious that • There is a potential for thousands of different multi-factor marketing machines that could be used for diagnostic purposes • Designing a useful one is part ART and part marketing Science