Download
1 / 14
140 likes | 333 Vues
CREC Spotlight on Plainville: Elementary SRBI Math. Maureen Brummett – Assistant Superintendent Tom Cannata – Math/Science Instructional Leader. December, 2011. Factors That Impacted The Math Intervention Process. Common Formative Assessments Data Decision Making

E N D
CRECSpotlight on Plainville:Elementary SRBI Math Maureen Brummett – Assistant Superintendent Tom Cannata – Math/Science Instructional Leader December, 2011
Factors That Impacted The Math Intervention Process • Common Formative Assessments • Data Decision Making • ISIP – Individualized Student Improvement Plan • SRBI Resources • SRBI Progress Monitoring • Grade Level Meetings / System of Care Process
Common Formative Assessments Various assessments are used to measure student achievement and monitor progress: • Basic Facts Assessment: • Benchmark assessments given 3x/year • Fall, Winter, Spring • Grades 1–5 • Addition, Subtraction, Multiplication, Division • Basic Facts Incentive Program: • Monthly assessments • Students create mid-year and end-of-year goals • Grades 1-5 • Math Prompts – Strand 25 - Math Applications • Analytic Rubric measures Understanding - Communication - Accuracy • Grades 1-5
Common Formative Assessments – cont. CREC Curriculum and Assessment Consortium • Fall Universal Screen: • Basic Numeracy Strands • Used to identify risk levels (High - Medium - Low) • Grades 2–5 • Winter CREC Assessment: • CREC assessment that is correlated to CMT • Teachers meet by grade level to score open-ended problems • January PD – Teachers review reports and plan SRBI groups • Grades 3-5 • Spring Universal Screen: • CREC assessment – Session 1 – Numerical and Proportional Reasoning strands • Grades 2-5
DATA DECISION MAKING - ISIP Several data points are considered when identifying high risk math students: • CMT results • CREC Universal Screen • Basic Facts Benchmark Assessments • Classroom performance ISIP – Individualized Student Improvement Plan • Teams meets to review data and determine high risk students • ISIP is written for each of these high risk students • SRBI plan is developed with specific instructional strategies and measurable goals
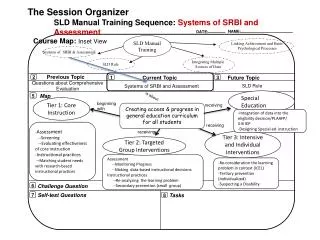
ISIP Sample • Assessment Data • CREC • Basic Facts • CMT • Diagnostic Data • Focus of Intervention • Intervention Strategies • Student Goals • SMART Goal • Baseline score • Target score • Target Date • Intervention Logistics • Intervention Schedule • Form of Progress Monitoring • Frequency of Progress Monitoring
SRBI RESOURCES District purchased intervention resources to provide explicit instructional strategies and lessons: • Pinpoint Math – Tier 2 • Math Connects – Strategic Intervention Guide – Tier 2 • Focus MATH – Tier 3 • Math Triumphs – Tier 3
SRBI PROGRESS MONITORING Progress monitoring tools that are used: • AIMSweb – MCOMP and MCAP probes • Progress monitoring assessments provided with RTI resources (Pinpoint Math, Focus MATH, Math Triumphs, etc.) • Basic Facts Assessments • CBM Probes – created from CREC Test Items
SRBI Intervention Group Log Weekly log that is used to record specific details about the interventions and to note any concerns about student progress and fidelity of intervention (i.e. absenteeism, engagement level, etc.)
SYSTEM OF CARE / GRADE LEVEL MEETINGS • Review ISIP plans, SMART goals, and data relative to instructional focus • Decide whether adequate progress is being made • If yes, set new goals or possibly discontinue Tier 2 and monitor Tier 1 performance • If limited progress and goal not met, develop plan of action (i.e. modify frequency, instructional emphasis, goals, shift to Tier 3) BENEFITS: • Multiple perspectives that allow for a comprehensive review of progress and goal setting • Reinforcement of data and decisions based on data
DATA MANAGEMENT Performance Pathways data management system recently implemented in the district • This is being used to track all of the state, district, and local assessment data (CMT, CREC, DRP, Basic Facts, etc.) • Shows student performance in various measurement areas over several years • Also used to track SRBI interventions – progress monitoring • Graphs student progress in SRBI • Various stakeholders are able to view SRBI progress monitoring results and trends
RESEARCH Assisting Students Struggling with Mathematics: RTI for Elementary and Middle Schools (Includes checklist, suggested approaches, potential roadblocks and solutions) Summary of recommendations: • Screen all students to identify those at risk • SRBI materials should focus intensely on whole numbers • Instruction should be explicit and systematic • Focus on solving word problems • Intervention materials should include visual representations of math ideas • Interventions should build on fluent retrieval of basic facts • Monitor progress of students at risk • Include motivational strategies in interventions What Works Clearinghouse – www.ies.ed.gov