Download
1 / 15
150 likes | 153 Vues
Non-Woven Fabrics demand stood at 48.41 Million Tonnes in 2020 and is forecast to reach 92.82 Million Tonnes by 2030, growing at a healthy CAGR of 6.26% until 2030

E N D
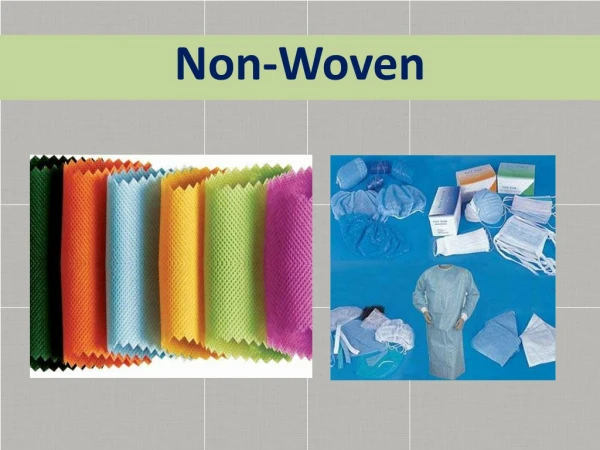
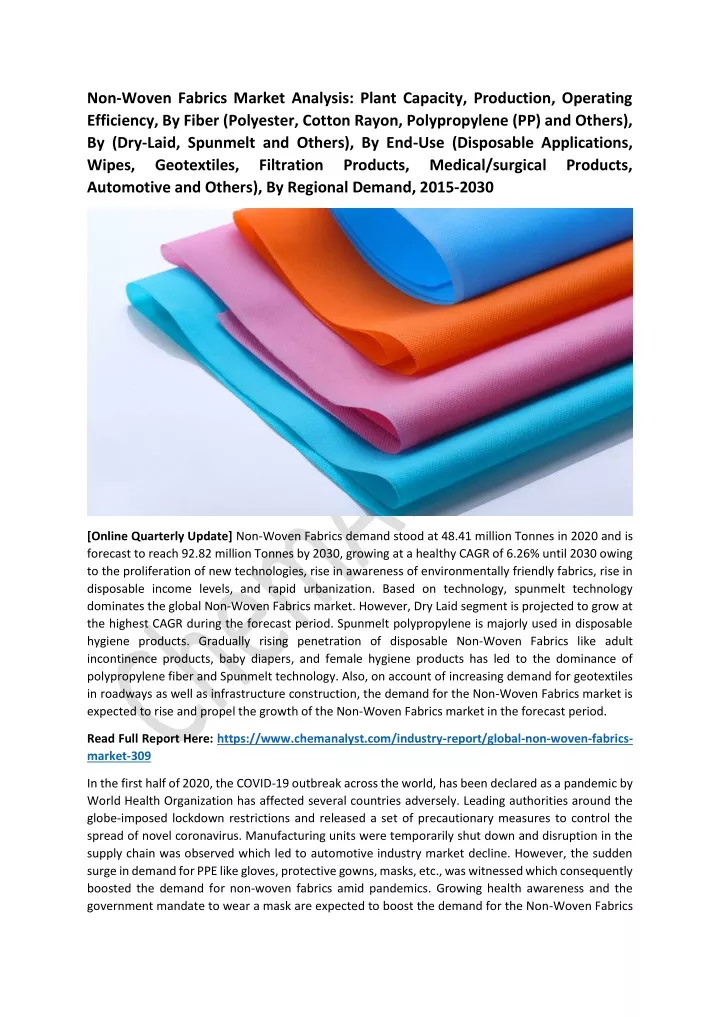
Non-Woven Fabrics Market Analysis: Plant Capacity, Production, Operating Efficiency, By Fiber (Polyester, Cotton Rayon, Polypropylene (PP) and Others), By (Dry-Laid, Spunmelt and Others), By End-Use (Disposable Applications, Wipes, Geotextiles, Filtration Products, Automotive and Others), By Regional Demand, 2015-2030 Medical/surgical Products, [Online Quarterly Update] Non-Woven Fabrics demand stood at 48.41 million Tonnes in 2020 and is forecast to reach 92.82 million Tonnes by 2030, growing at a healthy CAGR of 6.26% until 2030 owing to the proliferation of new technologies, rise in awareness of environmentally friendly fabrics, rise in disposable income levels, and rapid urbanization. Based on technology, spunmelt technology dominates the global Non-Woven Fabrics market. However, Dry Laid segment is projected to grow at the highest CAGR during the forecast period. Spunmelt polypropylene is majorly used in disposable hygiene products. Gradually rising penetration of disposable Non-Woven Fabrics like adult incontinence products, baby diapers, and female hygiene products has led to the dominance of polypropylene fiber and Spunmelt technology. Also, on account of increasing demand for geotextiles in roadways as well as infrastructure construction, the demand for the Non-Woven Fabrics market is expected to rise and propel the growth of the Non-Woven Fabrics market in the forecast period. Read Full Report Here: https://www.chemanalyst.com/industry-report/global-non-woven-fabrics- market-309 In the first half of 2020, the COVID-19 outbreak across the world, has been declared as a pandemic by World Health Organization has affected several countries adversely. Leading authorities around the globe-imposed lockdown restrictions and released a set of precautionary measures to control the spread of novel coronavirus. Manufacturing units were temporarily shut down and disruption in the supply chain was observed which led to automotive industry market decline. However, the sudden surge in demand for PPE like gloves, protective gowns, masks, etc., was witnessed which consequently boosted the demand for non-woven fabrics amid pandemics. Growing health awareness and the government mandate to wear a mask are expected to boost the demand for the Non-Woven Fabrics
market globally in the forecast period. The pricing of Non-Woven Fabrics is largely dependent on fluctuations in crude oil, Natural Gas, and other upstream sources. Years considered for this report: Historical Period: 2015-2019 Base Year: 2020 Estimated Year: 2021 Forecast Period: 2022–2030 This report will be delivered on an online digital platform with one-year subscription and quarterly update Objective of the Study: •To assess the demand-supply scenario of Non-Woven Fabrics which covers production, demand, and supply of Non-Woven Fabrics market globally. •To analyze and forecast the market size of non-woven fabrics. •To classify and forecast global Non-Woven Fabrics market based on fiber, technology, end- use and regional distribution. •To identify drivers and challenges for global Non-Woven Fabrics market. •To examine competitive developments such as expansions, new product launches, mergers & acquisitions, etc., in global Non-Woven Fabrics market. •To identify and analyze the profile of leading players involved in the manufacturing of non- woven fabrics. Regional Outlook: Based on regional analysis, the Asia Pacific region is expected to dominate the global Non-Woven Fabrics market. The dominance of Asia-Pacific in the global Non-Woven Fabrics market can be attributed to growing awareness about the benefits of Non-Woven Fabrics in the developing economies, like China and India, that account for the majority of the total Non-Woven Fabrics consumption demand worldwide.
Key Players: •Freudenberg Group •E. I. DUPONT DE NEMOURS AND COMPANY •Kimberly-Clark Corporation •Asahi Kasei Corporation •Welspun India Limited •Fiberweb India Limited •Fibertex Nonwovens A/S •Suominen Corporation •AutoTech Nonwovens Private Limited, etc. To extract data for global Non-Woven Fabrics market, primary research surveys were conducted with Non-Woven Fabrics manufacturers, suppliers, distributors, wholesalers and end users. While interviewing, the respondents were also inquired about their competitors. Through this technique, ChemAnalyst was able to include manufacturers that could not be identified due to the limitations of secondary research. Moreover, ChemAnalyst analyzed various end user segments and projected a positive outlook for Global Non-Woven Fabrics market over the coming years. ChemAnalyst calculated Non-Woven Fabrics demand globally by analyzing the historical data and demand forecast which was carried out considering imported styrene prices, a monomer used for production of Non-Woven Fabrics. ChemAnalyst sourced these values from industry experts and company representatives and externally validated through analyzing historical sales data of respective manufacturers to arrive at the overall market size. Various secondary sources such as company websites, association reports, annual reports, etc., were also studied by ChemAnalyst. Key Target Audience: •Non-Woven manufacturers and other stakeholders •Organizations, forums, and alliances related to non-Woven distribution •Government bodies such as regulating authorities and policy makers •Market research organizations and consulting companies The study is useful in providing answers to several critical questions that are important for industry stakeholders such as Non-Woven Fabrics manufacturers, customers and policy makers. The study would also help them to target the growing segments over the coming years (next two to five years), thereby aiding the stakeholders in taking investment decisions and facilitating their expansion. Report Scope: In this report, global Non-Woven Fabrics market has been segmented into following categories, in addition to the industry trends which have also been detailed below:
Attribute Details 48.41 million Tonnes Market size volume in 2020 92.82 million Tonnes Market size volume in 2030 Growth Rate CAGR of 6.26% from 2021 to 2030 2020 Base estimation year for Historic Data 2015 – 2019 Forecast period 2022 – 2030 Quantitative units Demand in tons and CAGR from 2021 to 2030 Report coverage Revenue forecast, demand & supply, competitive analysis, competitive landscape, growth factors, and trends Segments covered 1. Fiber: (Polypropylene, Cotton, Polyester, Rayon and Others) 2. Technology: (Spunmelt, Dry-Laid, Others) 3. End Use: (Disposable Products, Wipes, Geotextiles, Medical/Surgical Products, Filtration Products, Automotive, others) Regional scope North America; Europe; Asia Pacific; South America; Middle East & Africa Country scope United States; Mexico; Canada; China; India; Japan; South Korea; Taiwan; Singapore; Germany; Belgium; France; United Kingdom; Spain; Italy; Sweden; Austria; Saudi Arabia; Iran; South Africa; Brazil; Argentina Key profiled companies Freudenberg Group, E. I. DUPONT DE NEMOURS AND COMPANY, Kimberly-Clark Corporation, Asahi Kasei Corporation, Welspun India Limited, Fiberweb India Limited, Fibertex Nonwovens A/S, Suominen Corporation, AutoTech Nonwovens Private Limited, etc. Customization scope Free report customization with purchase. Addition or alteration to country, regional & segment scope. Pricing and purchase options Avail customized purchase options to meet your exact research needs. Explore purchase options TABLE OF CONTENTS: 1.Global Non-Woven Fabrics Market Outlook, 2015-2030 1.1.Capacity, By Volume 1.1.1.By Company 1.2.Production 1.2.1.By Company 1.3.Operating Efficiency 1.3.1.By Company 2.Global Non-Woven Fabrics Demand Outlook, 2015-2030, By Volume 2.1.By Fibre
2.2.By End Use 2.3.By Technology 2.4.By Region 2.5.By Company 3.North America Non-Woven Fabrics Market Outlook, 2015-2030 3.1.Capacity, By Volume 3.1.1.By Country 3.2.Production 3.2.1.By Country 3.3.Operating Efficiency 3.3.1.By Country 4.North America Non-Woven Fabrics Demand Outlook, 2015-2030, By Volume 4.1.By Fibre 4.2.By End Use 4.3.By Technology 4.4.By Country 4.5.United States Non-Woven Fabrics Market Outlook, 2015-2030 4.5.1.Capacity, By Volume 4.5.1.1. By Company 4.5.1.2. By Location 4.5.2.Production 4.5.2.1. By Company 4.5.3.Operating Efficiency 4.5.3.1. By Company 4.5.4.United States Non-Woven Fabrics Demand-Supply Scenario, 2015-2030, By Volume 4.5.4.1. Demand 4.5.4.2. Supply 4.5.4.3. Gap 4.5.5.United States Non-Woven Fabrics Demand Outlook, 2015-2030, By Volume 4.5.5.1. By Fibre 4.5.5.2. By End Use 4.5.5.3. By Technology 4.5.5.4. By Company Share (At least top 3 companies’ market share) 4.5.5.5. By Region 4.5.5.6. By Sales Channel 4.6.Mexico Non-Woven Fabrics Market Outlook, 2015-2030 4.6.1.Capacity, By Volume 4.6.1.1. By Company 4.6.1.2. By Location 4.6.2.Production 4.6.2.1. By Company 4.6.3.Operating Efficiency 4.6.3.1. By Company 4.6.4.Mexico Non-Woven Fabrics Demand-Supply Scenario, 2015-2030, By Volume 4.6.4.1. Demand 4.6.4.2. Supply 4.6.4.3. Gap 4.6.5.Mexico Non-Woven Fabrics Demand Outlook, 2015-2030, By Volume
4.6.5.1. 4.6.5.2. 4.6.5.3. 4.6.5.4. 4.6.5.5. 4.6.5.6. By Fibre By End Use By Technology By Company Share (At least top 3 companies’ market share) By Region By Sales Channel 4.7.Canada Non-Woven Fabrics Market Outlook, 2015-2030 4.7.1.Capacity, By Volume 4.7.1.1. By Company 4.7.1.2. By Location 4.7.2.Production 4.7.2.1. By Company 4.7.3.Operating Efficiency 4.7.3.1. By Company 4.7.4.Canada Non-Woven Fabrics Demand-Supply Scenario, 2015-2030, By Volume 4.7.4.1. Demand 4.7.4.2. Supply 4.7.4.3. Gap 4.7.5.Canada Non-Woven Fabrics Demand Outlook, 2015-2030, By Volume 4.7.5.1. By Fibre 4.7.5.2. By End Use 4.7.5.3. By Technology 4.7.5.4. By Company Share (At least top 3 companies’ market share) 4.7.5.5. By Region 4.7.5.6. By Sales Channel 5.Asia Pacific Non-Woven Fabrics Market Outlook, 2015-2030 5.1.Capacity, By Volume 5.1.1.By Country 5.2.Production 5.2.1.By Country 5.3.Operating Efficiency 5.3.1.By Country 6.Asia Pacific Non-Woven Fabrics Demand Outlook, 2015-2030, By Volume 6.1.By Fibre 6.2.Technology 6.3.By End Use 6.4.By Country 6.5.China Non-Woven Fabrics Market Outlook, 2015-2030 6.5.1.Capacity, By Volume 6.5.1.1. By Company 6.5.1.2. By Location 6.5.2.Production 6.5.2.1. By Company 6.5.3.Operating Efficiency 6.5.3.1. By Company 6.5.4.China Non-Woven Fabrics Demand-Supply Scenario, 2015-2030, By Volume 6.5.4.1. Demand 6.5.4.2. Supply
6.5.4.3. 6.5.5.China Non-Woven Fabrics Demand Outlook, 2015-2030, By Volume 6.5.5.1. By Fibre 6.5.5.2. By End Use 6.5.5.3. By Technology 6.5.5.4. By Company Share (At least top 3 companies’ market share) 6.5.5.5. By Region 6.5.5.6. By Sales Channel 6.6.India Non-Woven Fabrics Market Outlook, 2015-2030 6.6.1.Capacity, By Volume 6.6.1.1. By Company 6.6.1.2. By Location 6.6.2.Production 6.6.2.1. By Company 6.6.3.Operating Efficiency 6.6.3.1. By Company 6.6.4.India Non-Woven Fabrics Demand-Supply Scenario, 2015-2030, By Volume 6.6.4.1. Demand 6.6.4.2. Supply 6.6.4.3. Gap 6.6.5.India Non-Woven Fabrics Demand Outlook, 2015-2030, By Volume 6.6.5.1. By Fibre 6.6.5.2. By End Use 6.6.5.3. By Technology 6.6.5.4. By Company Share (At least top 3 companies’ market share) 6.6.5.5. By Region 6.6.5.6. By Sales Channel 6.7.Japan Non-Woven Fabrics Market Outlook, 2015-2030 6.7.1.Capacity, By Volume 6.7.1.1. By Company 6.7.1.2. By Location 6.7.2.Production 6.7.2.1. By Company 6.7.3.Operating Efficiency 6.7.3.1. By Company 6.7.4.Japan Non-Woven Fabrics Demand-Supply Scenario, 2015-2030, By Volume 6.7.4.1. Demand 6.7.4.2. Supply 6.7.4.3. Gap 6.7.5.Japan Non-Woven Fabrics Demand Outlook, 2015-2030, By Volume 6.7.5.1. By Fibre 6.7.5.2. By End Use 6.7.5.3. By Technology 6.7.5.4. By Company Share (At least top 3 companies’ market share) 6.7.5.5. By Region 6.7.5.6. By Sales Channel 6.8.South Korea Non-Woven Fabrics Market Outlook, 2015-2030 6.8.1.Capacity, By Volume Gap
6.8.1.1. 6.8.1.2. 6.8.2.Production 6.8.2.1. 6.8.3.Operating Efficiency 6.8.3.1. 6.8.4.South Korea Non-Woven Fabrics Demand-Supply Scenario, 2015-2030, By Volume 6.8.4.1. Demand 6.8.4.2. Supply 6.8.4.3. Gap 6.8.5.South Korea Non-Woven Fabrics Demand Outlook, 2015-2030, By Volume 6.8.5.1. By Fibre 6.8.5.2. By End Use 6.8.5.3. By Technology 6.8.5.4. By Company Share (At least top 3 companies’ market share) 6.8.5.5. By Region 6.8.5.6. By Sales Channel 6.9.Taiwan Non-Woven Fabrics Market Outlook, 2015-2030 6.9.1.Capacity, By Volume 6.9.1.1. By Company 6.9.1.2. By Location 6.9.2.Production 6.9.2.1. By Company 6.9.3.Operating Efficiency 6.9.3.1. By Company 6.9.4.Taiwan Non-Woven Fabrics Demand-Supply Scenario, 2015-2030, By Volume 6.9.4.1. Demand 6.9.4.2. Supply 6.9.4.3. Gap 6.9.5.Taiwan Non-Woven Fabrics Demand Outlook, 2015-2030, By Volume 6.9.5.1. By Fibre 6.9.5.2. By End Use 6.9.5.3. By Technology 6.9.5.4. By Region 6.9.5.5. By Sales Channel 6.9.5.6. By Company Share (At least top 3 companies’ market share) 6.10. Singapore Non-Woven Fabrics Market Outlook, 2015-2030 6.10.1.Capacity, By Volume 6.10.1.1. By Company 6.10.1.2. By Location 6.10.2.Production 6.10.2.1. By Company 6.10.3.Operating Efficiency 6.10.3.1. By Company 6.10.4.Singapore Non-Woven Fabrics Demand-Supply Scenario, 2015-2030, By Volume 6.10.4.1. Demand 6.10.4.2. Supply 6.10.4.3. Gap By Company By Location By Company By Company
6.10.5.Singapore Non-Woven Fabrics Demand Outlook, 2015-2030, By Volume 6.10.5.1. By Fibre 6.10.5.2. By End Use 6.10.5.3. By Technology 6.10.5.4. By Region 6.10.5.5. By Sales Channel 6.10.5.6. By Company Share (At least top 3 companies’ market share) 7.Europe Non-Woven Fabrics Market Outlook, 2015-2030 7.1.Capacity, By Volume 7.1.1.By Country 7.2.Production 7.2.1.By Country 7.3.Operating Efficiency 7.3.1.By Country 8.Europe Non-Woven Fabrics Demand Outlook, 2015-2030, By Volume 8.1.By Fibre 8.2.By End Use 8.3.By Technology 8.4.By Sales Channel (Direct/Institutional Sales, Retail Sales, Other Channel Sales) 8.5.By Country 8.6.Germany Non-Woven Fabrics Market Outlook, 2015-2030 8.6.1.Capacity, By Volume 8.6.1.1. By Company 8.6.1.2. By Location 8.6.2.Production 8.6.2.1. By Company 8.6.3.Operating Efficiency 8.6.3.1. By Company 8.6.4.Germany Non-Woven Fabrics Demand-Supply Scenario, 2015-2030, By Volume 8.6.4.1. Demand 8.6.4.2. Supply 8.6.4.3. Gap 8.6.5.Germany Non-Woven Fabrics Demand Outlook, 2015-2030, By Volume 8.6.5.1. By Fibre 8.6.5.2. By End Use 8.6.5.3. By Technology 8.6.5.4. By Company Share (At least top 3 companies’ market share) 8.6.5.5. By Region 8.6.5.6. By Sales Channel 8.6.6.Belgium Non-Woven Fabrics Market Outlook, 2015-2030 8.6.6.1. Capacity, By Volume 8.6.6.1.1. By Company 8.6.6.1.2. By Location 8.6.6.2. Production 8.6.6.2.1. By Company 8.6.6.3. Operating Efficiency 8.6.6.3.1. By Company 8.6.7.Belgium Non-Woven Fabrics Demand-Supply Scenario, 2015-2030, By Volume
8.6.7.1. 8.6.7.2. 8.6.7.3. 8.6.8.Belgium Non-Woven Fabrics Demand Outlook, 2015-2030, By Volume 8.6.8.1. By Fibre 8.6.8.2. By End Use 8.6.8.3. By Technology 8.6.8.4. By Sales Channel 8.6.8.5. By Company Share (At least top 3 companies’ market share) 8.6.8.6. By Region 8.7.France Non-Woven Fabrics Market Outlook, 2015-2030 8.7.1.Capacity, By Volume 8.7.1.1. By Company 8.7.1.2. By Location 8.7.2.Production 8.7.2.1. By Company 8.7.3.Operating Efficiency 8.7.3.1. By Company 8.7.4.France Non-Woven Fabrics Demand-Supply Scenario, 2015-2030, By Volume 8.7.4.1. Demand 8.7.4.2. Supply 8.7.4.3. Gap 8.7.5.France Non-Woven Fabrics Demand Outlook, 2015-2030, By Volume 8.7.5.1. By Fibre 8.7.5.2. By End Use 8.7.5.3. By Technology 8.7.5.4. By Sales Channel 8.7.5.5. By Company Share (At least top 3 companies’ market share) 8.7.5.6. By Region 8.8.United Kingdom Non-Woven Fabrics Market Outlook, 2015-2030 8.8.1.Capacity, By Volume 8.8.1.1. By Company 8.8.1.2. By Location 8.8.2.Production 8.8.2.1. By Company 8.8.3.Operating Efficiency 8.8.3.1. By Company 8.8.4.United Kingdom Non-Woven Fabrics Demand-Supply Scenario, 2015-2030, By Volume 8.8.4.1. Demand 8.8.4.2. Supply 8.8.4.3. Gap 8.8.5.United Kingdom Non-Woven Fabrics Demand Outlook, 2015-2030, By Volume 8.8.5.1. By Fibre 8.8.5.2. By End Use 8.8.5.3. By Technology 8.8.5.4. By Sales Channel 8.8.5.5. By Company Share (At least top 3 companies’ market share) Demand Supply Gap
8.8.5.6. By Region 8.9.Spain Non-Woven Fabrics Market Outlook, 2015-2030 8.9.1.Capacity, By Volume 8.9.1.1. By Company 8.9.1.2. By Location 8.9.2.Production 8.9.2.1. By Company 8.9.3.Operating Efficiency 8.9.3.1. By Company 8.9.4.Spain Non-Woven Fabrics Demand-Supply Scenario, 2015-2030, By Volume 8.9.4.1. Demand 8.9.4.2. Supply 8.9.4.3. Gap 8.9.5.Spain Non-Woven Fabrics Demand Outlook, 2015-2030, By Volume 8.9.5.1. By Fibre 8.9.5.2. By End Use 8.9.5.3. By Technology 8.9.5.4. By Sales Channel 8.9.5.5. By Company Share (At least top 3 companies’ market share) 8.9.5.6. By Region 8.10. Italy Non-Woven Fabrics Market Outlook, 2015-2030 8.10.1.Capacity, By Volume 8.10.1.1. By Company 8.10.1.2. By Location 8.10.2.Production 8.10.2.1. By Company 8.10.3.Operating Efficiency 8.10.3.1. By Company 8.10.4.Italy Non-Woven Fabrics Demand-Supply Scenario, 2015-2030, By Volume 8.10.4.1. Demand 8.10.4.2. Supply 8.10.4.3. Gap 8.10.5.Italy Non-Woven Fabrics Demand Outlook, 2015-2030, By Volume 8.10.5.1. By Fibre 8.10.5.2. By End Use 8.10.5.3. By Technology 8.10.5.4. By Sales Channel 8.10.5.5. By Company Share (At least top 3 companies’ market share) 8.10.5.6. By Region 8.11. Sweden Non-Woven Fabrics Market Outlook, 2015-2030 8.11.1.Capacity, By Volume 8.11.1.1. By Company 8.11.1.2. By Location 8.11.2.Production 8.11.2.1. By Company 8.11.3.Operating Efficiency 8.11.3.1. By Company 8.11.4.Sweden Non-Woven Fabrics Demand-Supply Scenario, 2015-2030, By Volume
8.11.4.1. 8.11.4.2. 8.11.4.3. 8.11.5.Sweden Non-Woven Fabrics Demand Outlook, 2015-2030, By Volume 8.11.5.1. By Fibre 8.11.5.2. By End Use 8.11.5.3. By Technology 8.11.5.4. By Sales Channel 8.11.5.5. By Company Share (At least top 3 companies’ market share) 8.11.5.6. By Region 8.12. Austria Non-Woven Fabrics Market Outlook, 2015-2030 8.12.1.Capacity, By Volume 8.12.1.1. By Company 8.12.1.2. By Location 8.12.2.Production 8.12.2.1. By Company 8.12.3.Operating Efficiency 8.12.3.1. By Company 8.12.4.Austria Non-Woven Fabrics Demand-Supply Scenario, 2015-2030, By Volume 8.12.4.1. Demand 8.12.4.2. Supply 8.12.4.3. Gap 8.12.5.Austria Non-Woven Fabrics Demand Outlook, 2015-2030, By Volume 8.12.5.1. By Fibre 8.12.5.2. By End Use 8.12.5.3. By Technology 8.12.5.4. By Sales Channel 8.12.5.5. By Company Share (At least top 3 companies’ market share) 8.12.5.6. By Region 9.MEA Non-Woven Fabrics Market Outlook, 2015-2030 9.1.Capacity, By Volume 9.1.1.By Country 9.2.Production 9.2.1.By Country 9.3.Operating Efficiency 9.3.1.By Country 10.MEA Non-Woven Fabrics Demand Outlook, 2015-2030, By Volume 10.1. By Fibre 10.2. By End Use 10.3. By Sales Channel 10.4. By Country 10.5. Saudi Arabia Non-Woven Fabrics Market Outlook, 2015-2030 10.5.1.Capacity, By Volume 10.5.1.1. By Company 10.5.1.2. By Location 10.5.2.Production 10.5.2.1. By Company 10.5.3.Operating Efficiency Demand Supply Gap
10.5.3.1. 10.5.4.Saudi Arabia Non-Woven Fabrics Demand-Supply Scenario, 2015-2030, By Volume 10.5.4.1. Demand 10.5.4.2. Supply 10.5.4.3. Gap 10.5.5.Saudi Arabia Non-Woven Fabrics Demand Outlook, 2015-2030, By Volume 10.5.5.1. By Fibre 10.5.5.2. By End Use 10.5.5.3. By Technology 10.5.5.4. By Sales Channel 10.5.5.5. By Company Share (At least top 3 companies’ market share) 10.5.5.6. By Region 10.6. Iran Non-Woven Fabrics Market Outlook, 2015-2030 10.6.1.Capacity, By Volume 10.6.1.1. By Company 10.6.1.2. By Location 10.6.2.Production 10.6.2.1. By Company 10.6.3.Operating Efficiency 10.6.3.1. By Company 10.6.4.Iran Non-Woven Fabrics Demand-Supply Scenario, 2015-2030, By Volume 10.6.4.1. Demand 10.6.4.2. Supply 10.6.4.3. Gap 10.6.5.Iran Non-Woven Fabrics Demand Outlook, 2015-2030, By Volume 10.6.5.1. By Fibre 10.6.5.2. By End Use 10.6.5.3. By Technology 10.6.5.4. By Sales Channel 10.6.5.5. By Company Share (At least top 3 companies’ market share) 10.6.5.6. By Region 10.7. South Africa Non-Woven Fabrics Market Outlook, 2015-2030 10.7.1.Capacity, By Volume 10.7.1.1. By Company 10.7.1.2. By Location 10.7.2.Production 10.7.2.1. By Company 10.7.3.Operating Efficiency 10.7.3.1. By Company 10.7.4.South Africa Non-Woven Fabrics Demand-Supply Scenario, 2015-2030, By Volume 10.7.4.1. Demand 10.7.4.2. Supply 10.7.4.3. Gap 10.7.5.South Africa Non-Woven Fabrics Demand Outlook, 2015-2030, By Volume 10.7.5.1. By Fibre 10.7.5.2. By End Use 10.7.5.3. By Technology 10.7.5.4. By Sales Channel By Company
10.7.5.5. 10.7.5.6. By Company Share (At least top 3 companies’ market share) By Region 11.South America Non-Woven Fabrics Market Outlook, 2015-2030 11.1. Capacity, By Volume 11.1.1.By Country 11.2. Production 11.2.1.By Country 11.3. Operating Efficiency 11.3.1.By Country 12.South America Non-Woven Fabrics Demand Outlook, 2015-2030, By Volume 12.1. By Fibre 12.2. By End Use 12.3. By Technology 12.4. By Sales Channel (Direct/Institutional Sales, Retail Sales, Other Channel Sales) 12.5. By Company Share (At least top 3 companies’ market share) 12.6. By Country 12.7. Brazil Non-Woven Fabrics Market Outlook, 2015-2030 12.7.1.Capacity, By Volume 12.7.1.1. By Company 12.7.1.2. By Location 12.7.2.Production 12.7.2.1. By Company 12.7.3.Operating Efficiency 12.7.3.1. By Company 12.7.4.Brazil Non-Woven Fabrics Demand-Supply Scenario, 2015-2030, By Volume 12.7.4.1. Demand 12.7.4.2. Supply 12.7.4.3. Gap 12.7.5.Brazil Non-Woven Fabrics Demand Outlook, 2015-2030, By Volume 12.7.5.1. By Fibre 12.7.5.2. By End Use 12.7.5.3. By Technology 12.7.5.4. By Sales Channel 12.7.5.5. By Company Share (At least top 3 companies’ market share) 12.7.5.6. By Region 12.8. Argentina Non-Woven Fabrics Market Outlook, 2015-2030 12.8.1.Capacity, By Volume 12.8.1.1. By Company 12.8.1.2. By Location 12.8.2.Production 12.8.2.1. By Company 12.8.3.Operating Efficiency 12.8.3.1. By Company 12.8.4.Argentina Non-Woven Fabrics Demand-Supply Scenario, 2015-2030, By Volume 12.8.4.1. Demand 12.8.4.2. Supply 12.8.4.3. Gap 12.8.5.Argentina Non-Woven Fabrics Demand Outlook, 2015-2030, By Volume
12.8.5.1. 12.8.5.2. 12.8.5.3. 12.8.5.4. 12.8.5.5. 12.8.5.6. By Fibre By End Use By Technology By Sales Channel By Company Share (At least top 3 companies’ market share By Region 13.Country-wise Import 14.Country-wise Export 15.News and Deals About Us ChemAnalyst is a leading provider of chemical commodity prices in more than 12 countries from last 4 Years. The company has emerged as a preferred pricing supplier amongst Procurement Managers and Strategy Professionals globally who wants to track near real time prices of chemicals on its interactive dashboard. Unlike most of its competitors such as ICIS, IHS & S&P Platts the company doesn’t believe in delivering prices in PDF reports. The company has developed proprietary algorithm based online subscription platform in which users can track years of historical prices of more than 250 chemical commodities. In addition, since it’s all online, the users cannot just compare prices across multiple countries but also with other commodities and play with the data by generating multiple graphs to find out amazing insights. The users get access to grade wise CIF, CFR & Ex Works prices at multiple ports in each country. ChemAnalyst also provides market analysis for more than 1000+ chemical commodities such as Production, Demand, Supply, Plant Operating Rate, Imports, Exports, Suppliers, Customers and much more. The company has created online interactive dashboard in which customers can access all this data instantly with a click of a button. The users will not only be able to analyse historical data for past years but will also get to analyse short term and long-term forecasts for coming years. With the access to local field teams, the company can provide high quality reliable market analysis data for more than 20 countries. ChemAnalyst is a one stop solution for all the data related needs. We at ChemAnalyst are committed to assist customers worldwide with their data and insights needs using our comprehensive online platform. For more information, please visit us at www.chemanalyst.com Contact Us: Nilesh Vishwakarma B-44 Sector-57 Noida, National Capital Region Tel: 0120-4523948 Mob: +91-8882336899 Email: info@chemanalyst.com