Download
1 / 30
300 likes | 384 Vues
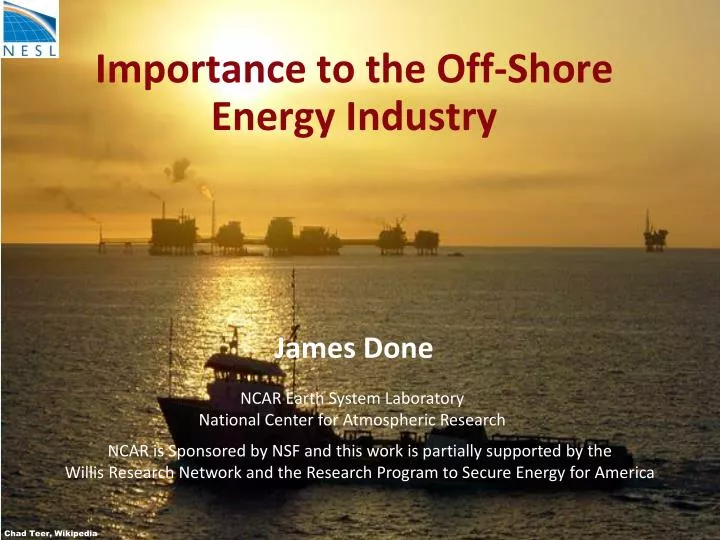
Importance to the Off-Shore Energy Industry James Done. NCAR Earth System Laboratory National Center for Atmospheric Research. NCAR is Sponsored by NSF and this work is partially supported by the Willis Research Network and the Research Program to Secure Energy for America.

E N D
Importance to the Off-Shore Energy IndustryJames Done NCAR Earth System Laboratory National Center for Atmospheric Research NCAR is Sponsored by NSF and this work is partially supported by the Willis Research Network and the Research Program to Secure Energy for America Chad Teer, Wikipedia
Outline Historical Gulf Storms Large-Scale Drivers of Gulf Storms Storms, Climate Variability and Change over the Gulf - NRCM - Emanuel Model Assessing the Impact of Climate Variability and Change on Storm Damage
Historical Gulf Storms 1966-2008: Average 4.0 storms/yr in blue box, 1.7 storms/yr in red box Genesis locations of storms that entered the red box. ¼ formed in black box. Timeseries of basin-wide storm counts (blue), storms that entered red box (red) and ratio (black) 1966 2007
Large-Scale Drivers of Gulf Storms The favorable summer climate is modulated by variability on a range of temporal and spatial scales. Atmospheric Drivers: - low latitude wave activity, - wave amplification zones. Oceanic Drivers: - loop current Coupled Drivers: El-Nino, Atlantic Meridional Mode and the Atlantic Multi-Decadal Oscillation . . .
Example: Madden-Julian Oscillation The MJO is an eastward moving equatorial disturbance. Tracks of storms separated by phase of the MJO TC genesis is 3.5 times more likely during westerly phase of the MJO. Maloney and Hartmann (2000)
Ocean Trends Global model is fully coupled to the sea. Global model shows a dramatic increase in Tropical Cyclone Heat Potential and an increase in the 70m temperature. Global model has a negative bias but recent increase has also been observed.
Downscaling with NRCM: TC Numbers 1995 – 2005 2020 – 2030 2045 - 2055 15 10 20 • Multi-Decadal variability in Northern Gulf storm counts
Downscaling with NRCM: TC Intensity Distributions of max wind for all cyclones moving over the area occupied by offshore energy facilities in the Gulf of Mexico: NRCM vs Obs NRCM: Time-Slices
Downscaling with Emanuel Model: Normalized Track Density • No mechanisms for low-latitude formation • No change in storm counts in Gulf
Downscaling with Emanuel Model: Intensity Distributions of max wind for all cyclones moving over the area occupied by offshore energy facilities in the Gulf of Mexico: Emanuel (green) vs Obs (blue) Emanuel: Time-Slices
Assessing Damage: The Willis Hurricane Index • Goal: To develop a comprehensive hurricane damage index. Initial development for the Off-Shore facilities in the Gulf. • Adaptable to: • Real-time Damage Forecasts • - uses only information readily available in advisory reports from the relevant hurricane warning center. • Seasonal and Climate Variability and Change • - all parameters can be extracted directly from dynamical seasonal prediction and climate models. Thunderhorse after Hurricane Dennis 2005
Lat/Lon Box used for WHI 87°W 100°W 26°N
Data and Methods • Data: • Willis Energy Loss Data (WELD) for the Gulf of Mexico (7 hurricanes) inflated by CEPCI (Arnold and Chiltern 1963) to 1998 values; • Critical Hurricane Parameters: • The amount of energy dissipated at the surface by maximum winds • The radial extent and character of the surface wind field (n mile) • The translational speed of the hurricane (kt). • Combined these are a proxy for waves, currents and storm surge.
Data and Method ctd. • Method: • Base development largely on physical principles with care not to over specify the use of the small available data base; • Independent testing to come from application during 2010 hurricane season; • Combine the three critical factors in an additive formula:
Parameter Contributions Intensity=0.23 Size=0.48 Translation Speed=0.71
Parameter Determination • Intensity Term: • Set aa=3 following Emanuel (2005) Power Dissipation Index • Normalise by setting vm0=65 kt • Constrained to hurricanes vm>65 kt • Set a=1 through experimentation and sensitivity analysis
Parameter Determination • Size Term: • Set bb=1 for consistency with areal coverage of storm winds, given translation • Normalise by setting Rh0=50 n mile • Set b=5 through experimentation and sensitivity analysis
Parameter Determination • Translation Term: • Set cc=2 from regression on available data • Normalise by setting vt0=15 kt • Set c=5 through experimentation and sensitivity analysis • Also set vt <25kt on physical grounds and >7kt based on a posteriori checking.
Application to Gulf Losses Maximum WHI vs Losses R2 =0.96 Average WHI vs Losses R2 =0.91
Application to Climate Variability and Change: NRCM and Emanuel Storms • Changed Vm threshold from 65 to 34 kts. i.e. from Cat 1 to tropical storm strength. • All parameters extracted directly from NRCM and Emanuel Model Storms
Lat/Lon Box used for WHI Calculations 87°W 100°W 26°N
WHI Results NRCM 1995-2005 2020-2030 2045-2055 15 10 20 Emanuel Model • NRCM storms show multi-decadal variability whereas Emanuel storms show almost no change. • Emanuel storms are slower → higher average damage. • NRCM storms can be very large →higher maximum damage
WHI Results NRCM 1995-2005 2020-2030 2045-2055 15 10 20 Emanuel Model • NRCM storms show multi-decadal variability whereas Emanuel storms show almost no change. • Emanuel storms are slower → higher average damage. • NRCM storms can be very large →higher maximum damage
For Gulf Offshore Facilities Real-time Forecasts Seasonal and Climate Variability and Change Potential Extension to Universal Application (Landfall) Similar physical principles apply (intensity, size, translation speed), but: Heterogeneity of landfall infrastructure and topography; Variability in building codes and designs; Lack of impact data. WHI Summary
Summary • Gulf storms have both local and remote influences. • important for investigations into future Gulf Storms. • Global model shows dramatic increase in TC heat potential over the Gulf. – need a fully coupled high resolution model to realize this energy source. • Application of WHI provides a first order assessment of likely changes in net damage to off-shore facilities. • Results based on NRCM and Emanuel storms are limited by small sample size. • NRCM 12 km currently underway. • - apply Emanuel model to ensemble of global model future climates.
Downscaling with Emanuel Model: Intensity Average max Max max Count*factor 1995-2005 31.25 74.32 116 Obs 31.08 67.85 31 2020-2030 34.57 69.40 81 2045-2055 32.44 65.01 101