Download
1 / 82
830 likes | 1k Vues
Highway Maintenance Performance Measurement Annual Report September 2004. Annual Report Contents. Executive Summary pages 3 - 19 Performance Measurement Index

E N D
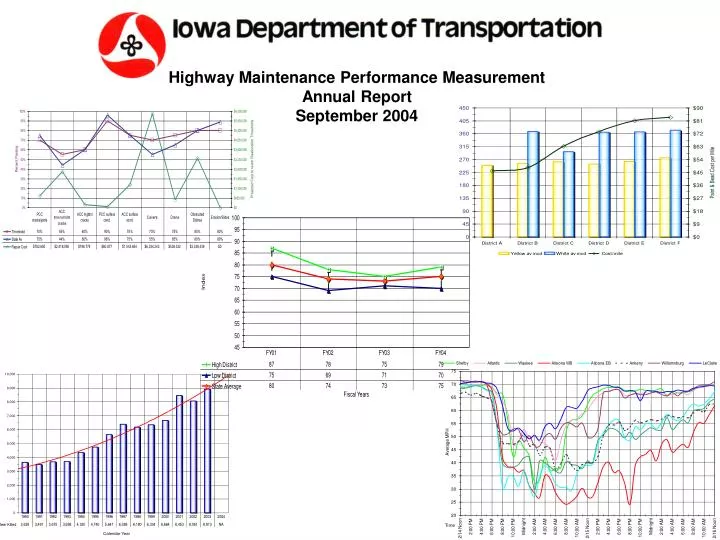
Highway Maintenance Performance MeasurementAnnual ReportSeptember 2004
Annual Report Contents • Executive Summary pages 3 - 19 • Performance Measurement Index • Reallocation Thresholds, FY 04 State Average Performance & Repair Costs to Bring All Districts up to the Reallocation Thresholds • Comparisons of Measures for Four Fiscal Years pages 20 - 57 • Safety • Motorist Services • Preservation • Review of the Start of Calendar Year 2004 Paint Striping pages 59 - 65 • Automated Performance Measures for Snow & Ice Results pages 66 - 76 • Dead Deer Removal Report for Government Oversight Committee pages 77 - 82
Executive Summary • Performance Measurement Index pages 4 - 15 • Composite Index • Road Surface Index • Shoulder Index • Roadside/Drainage Index • Traffic Services Index • Reallocation Thresholds, FY 04 State Average Performance pages 16 - 19 & Repair Costs to Bring All Districts up to the Reallocation Thresholds • Safety • Services • Preservation
Performance Measurement Index The Performance Measurement Index, formerly referred to as weighted scores, utilizes weighting factors to produce yield a possible score of 100 for a composite score and for each of the four categories: Road Surface, Shoulders, Roadside/Drainage and Traffic Services. • Safety elements assigned a weight of 5 for the percent passing include: Pavement Potholes/Spalls & Ruts; Shoulder Drop-off/Build-up; Signs & Delineator/Hazard Markers Missing or Damaged; Pavement Markings; Guard Rail; Trees in the Clear Zone or Interfering with Roadside Safety Features. • Motorist Services elements assigned a weight of 3 for the percent passing include: Pavement Bumps & Depressions; Signs & Delineator/Hazard Markers Height & Vertical; Culvert & Station Markers Missing/Damaged Height/Vertical; Noxious Weeds & Mowing; Dead Animals or Litter Visible from the Roadway. • Preservation elements assigned a weight of 1 for the percent passing include: Pavement Cracks/Joints & Surface Condition; Culverts & Drains Damaged or Obstructed; Obstructed Water Flow in Ditches & Erosion/Slides.
Performance Measurement Index Fiscal Year 2001 through 2004 • Question: What are the statewide trends and variations for the status of the system for the last four fiscal years? • Data: • The Composite, Road Surface, Shoulder State Average Indices show a mild trend downward from the FY 2001 baseline for FY 2002 - 2003 with a mild increase for FY 2004. There is moderate variation among the Districts. • The Roadside State Average Index also shows a mild trend downward from the FY 2001 baseline for FY 2002 - 2003 with a mild increase for FY 2004. There is fairly substantial variation among the Districts, with a mean variation of 15 points for the four fiscal years. • The Traffic Services State Average Index shows a drop of 19 points from the FY 2001 baseline to FY 2002 and then stabilizing for the last two fiscal years. The mean variation of 22 points among the Districts is substantial.
Reallocation Thresholds, FY 2004 State Average Performance& Projected Repair Costs • Selected Performance Measurement Elements are Arranged by: • Safety • Motorist Services • Preservation • Repair costs may be projected when the state average is above the Reallocation Threshold if some Districts are below the Threshold • Paths to Additional Information on DOTNET: • Background on Reallocation Thresholds:DOTNET Highway Statewide Operations Maintenance Performance Measurement Process What is a Reallocation Threshold • Reallocation Threshold Values: DOTNET Highway Statewide Operations Maintenance Performance Measurement Process Reallocation Threshold Values • Calculations for Projected Repair Costs:DOTNET Highway Statewide Operations Maintenance Performance Measurement Results Cost to Fix Data • Measured Elements that are not included in this report: • Paved Shoulder: Potholes/Spalls, Faulting/Rolldown, Cracks/Joints, Bumps/Depressions, Surface Condition • Unpaved Shoulder: Cross-slope, Surface Condition • Cable Guardrail, Concrete Barrier Walls, Illumination
SAFETYReallocation Thresholds, FY 04 State Average Performance& Repair Costs to Bring All Districts up to the Reallocation Thresholds
MOTORIST SERVICESReallocation Thresholds, FY 04 State Average Performance& Repair Costs to Bring All Districts up to the Reallocation Thresholds
PRESERVATIONReallocation Thresholds, FY 04 State Average Performance& Repair Costs to Bring All Districts up to the Reallocation Thresholds
Comparison of Measures for Four Fiscal Years • Measurements of Percent Passing are shown for all of the Fiscal Years of the program: Fiscal YearCalendar Year Survey Cycles • 2001 Summer 2000, Fall 2000, & Spring 2001 • 2002 Summer 2001, Fall 2001, & Spring 2002 • 2003 Summer 2002, Fall 2002, & Spring 2003 • 2004 Summer 2003, Fall 2003, & Spring 2004 • The same Elements from the previous section are arranged by Safety, Motorist Services & Preservation • Each graph shows for each Fiscal Year the State Average with the Scores for the Districts with the Highest Average & Lowest Average • Each graph indicates the Reallocation Threshold & Mean Sample Size for that Element per Fiscal Year • Paths to Additional Information on DOTNET: • Element Definitions & Measurement Methodology:DOTNET Highway Statewide Operations Maintenance Performance Measurement Process Printable Performance Measurement Manual • Data from individual Survey Cycles:DOTNET Highway Statewide Operations Maintenance Performance Measurement Results Tabulated & Graphed Data Percent Passing
Comparisons of Measures for Four Fiscal Years • Safety pages 23 - 36 • Pavement Markings • Beam Guardrail • PCC Potholes/Spalls • ACC Potholes • ACC Wheel Ruts • Paved Shoulder Drop-off or Build-up • Unpaved Shoulder Drop-off or Build-up • Signs Missing or Damaged • Delineators & Hazard Markers Missing or Damaged • Trees in Clear Zone or Interfering with Roadside Safety Features • Motorist Services pages 37 - 48 • PCC Bumps or Depressions • ACC Bumps or Depressions • PCC Faulting • ACC Rolldown • Sign Height & Vertical • Delineators & Hazard Markers Height & Vertical • Culvert & Station Markers Missing or Damaged • Culvert & Station Markers Height & Vertical • Noxious Weeds • Mowing • Litter Visible from Roadway • Dead Animals Visible from Roadway
Comparisons of Measures for Four Fiscal Years [continued] • Preservation pages 49 - 57 • PCC Pavement Cracks & Joints • ACC Pavement Transverse & Random Cracks • ACC Pavement Longitudinal Cracks • PCC Surface Condition • ACC Surface Condition • Culverts Damaged or Obstructed • Drains Damaged or Obstructed • Obstructed Water Flow in Ditches • Slope Erosion & Slides
Questions: • Are comparisons of amounts passing [counts, linear feet, square feet] better indicators of condition for some performance measurement elements than the current standard measure of sample sites passed? • How much of guardrail defects are due to height? • Discussion: In some District meetings in late 2003, there was discussion of whether some elements, such as pavement markings and guardrail, would have their condition portrayed more accurately by the percentage of linear feet passing instead of the percentage of sample sites passing. In general, percentage of sites passing are used to describe system status and amounts passing are used to calculate projected repair costs. • Data: • The next four pages compare the two different approaches for pavement markings and beam guardrail. • Whichever approach is used, height is the prevalent defect, based on the last 4 survey cycles. Comparisons of Measures for Four Fiscal Years
SAFETYPavement Markings by Sample Sitesreallocation threshold = 75% mean sample per fiscal year = 5,144 sites
SAFETYPavement Markings by Linear Feet of Paint Stripingreallocation threshold = 75% mean sample per fiscal year = 5,903,499 linear feet
SAFETYBeam Guardrail by Sample Sitesreallocation threshold = 65% mean sample per fiscal year = 294 sites
SAFETYBeam Guardrail by Linear Feet of Guardrailreallocation threshold = 65% mean sample per fiscal year = 63,867 linear feet
SAFETYPCC Potholes/Spallsreallocation threshold = 90% mean sample per fiscal year = 1,773
SAFETYACC Potholesreallocation threshold = 90% mean sample per fiscal year = 3,556
SAFETYACC Wheel Rutsreallocation threshold = 80% mean sample per fiscal year = 3,556
SAFETYPaved Shoulder Drop-off/Build-upreallocation threshold = 90% mean sample per fiscal year = 1,127
SAFETYUnpaved Shoulder Drop-off/Build-upreallocation threshold = 80% mean sample per fiscal year = 4,021
SAFETYSigns Missing or Damagedreallocation threshold = 80% mean sample per fiscal year = 3,051
SAFETYDelineators & Hazard Markers Missing or Damagedreallocation threshold = 80% mean sample per fiscal year = 1,867
SAFETYTrees/Shrubs in Clear Zone or Interfering with Roadside Safety Featuresreallocation threshold = 95% mean sample per fiscal year = 4,991
SERVICESPCC Pavement Bumps/Depressionsreallocation threshold = 90% mean sample per cycle = 1,745
SERVICESACC Pavement Bumps/Depressionsreallocation threshold = 90% mean sample per cycle = 3,536
SERVICESPCC Faultingreallocation threshold = 90% mean sample per cycle = 1,743
SERVICESACC Rolldownreallocation threshold = 90% mean sample per cycle = 3,533
SERVICESSign Height & Verticalreallocation threshold = 65% mean sample per cycle = 3,051
SERVICESDelineators & Hazard Markers Height & Verticalreallocation threshold = 65% mean sample per cycle = 1,862
SERVICESCulvert & Station Markers Missing or Damagedreallocation threshold = 65% mean sample per cycle = 4,692
SERVICESCulvert & Station Markers Height & Verticalreallocation threshold = 65% mean sample per cycle = 4,692
SERVICESNoxious Weedsreallocation threshold = 70% mean sample per cycle = 4,964
SERVICESMowingreallocation threshold = 85% mean sample per cycle = 4,872
SERVICESDead Animals Visible from Roadwayreallocation threshold = 90% mean sample per cycle = 5,134
SERVICESLitterreallocation threshold = 65% mean sample per cycle = 5,048
PRESERVATIONPCC Pavement Cracks/Jointsreallocation threshold = 70% mean sample per cycle = 1,730
PRESERVATIONACC Pavement Transverse & Random Cracksreallocation threshold = 55% mean sample per cycle = 3,528