Download
1 / 15
150 likes | 333 Vues
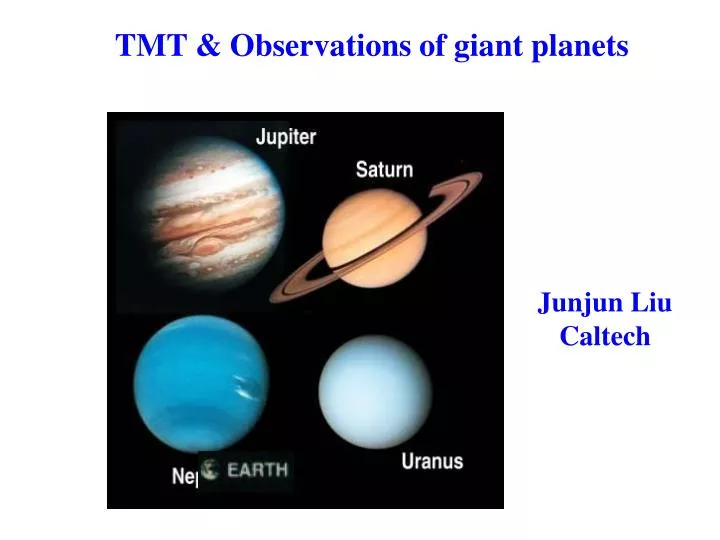
TMT & Observations of giant planets. Junjun Liu Caltech. The Thirty Meter Telescope (TMT) is a 30 m ground based telescope with a collecting area of 650 m 2 . It will observe through the atmospheric windows from 0.31 to 28 μ m .

E N D
TMT & Observations of giant planets Junjun Liu Caltech
The Thirty Meter Telescope (TMT) is a 30 m ground based telescope with a collecting area of 650 m2. • It will observe through the atmospheric windows from 0.31 to 28 μ m. • Advanced adaptive optics capabilities will allow highly sensitive, diffraction-limited observations beyond 1 μ m over most of the sky. TMT Jupiter’s infrared spectrum TMT gives unprecedented opportunity to retrieve the abundance of multiple species simultaneously over a wide spectral range.
Jupiter: Vortices Fletcher et al. (2010) • TMT can be used to study the detailed structures of large coherent vortices on Jupiter, such as the Great Red Spot (GRS) and white ovals, as well as their temporal variability. • Highly sensitive and diffraction-limited observations of TMT can increase the information content and enable better retrieval of temperature, composition (Ammonia, Phosphine, and para-Hydrogen) and aerosol structure of vortices.
Thermal waves are ubiquitous in Jupiter’s atmosphere, in particular, in the equatorial region (~ 15 N and ~15 S). • Better characterization of the thermal waves would greatly enhance our understanding about their generation mechanisms, and their influence to the atmospheric circulation. • TMT could be used to investigate the vertical structure of the waves, as well as the propagation direction and speed. Jupiter: Atmospheric thermal waves
Jupiter: Color • What determines the color of the cloud bands? NH4SH ice? (Baines et al. 2004)? • How does the composition couple with temperature and flow fields?
Jupiter: Global upheaval • Jupiter’s visible cloud structure undergo a sudden upheaval where belts and zone change color (e.g., Rogers 1995). • Measurements of the temperature and composition fields, and the opacity and vertical distribution of cloud provide direct clues to particulate cloud chemistry and atmospheric dynamicsaccompanying the color change.
Jupiter’s stratosphere undergoes “quasi-quadrennial” oscillation (QQO) with period of 4 ~ 5 years. It is similar with the QBO in Earth’s atmospheres. • How does the low-frequency variability is generated? What determines its characteristic time scale? • Is the global upheaval related to the different phases of QQO? Jupiter: Low frequency variability Observed equatorial temperature oscillation on Jupiter (Leovy et al., 1991)
Saturn: Low frequency variability • Saturn’s stratosphere undergoes “quasi-semiannual” oscillation with period of 14 ~15 years. It is likely related to Saturn’s seasonal variation. But how? NASA (IRTF), Orton et al. 2008
Saturn: Giant storm • TMT can be used to monitor the onset, develop and decay of the large scale convective storm.
TMT can be used to characterize distinct features on Saturn: such as the hexagon polar vortices and ribbon-like feature. • Such observation can constrain the global circulation model and shed light on the underlying dynamics. Saturn: Hexagon polar vortices and Ribbon-like feature Liu et al. 2010 NASA image collection
Uranus: Previous observations Orton et al. 2012 Photometric (low-resolution) modes of Spitzer Infrared Spectrometer (IRS) spectroscopy of Uranus. • The ground-based observations could constrain the bulk composition and the mean vertical distribution of temperatures and abundance of gases, such as He/H2 ratio, para-H2 fraction and hydrocarbon abundance (Burgdorf et al. 2006; Hesmann et al. 2006).
Uranus: troposphere and stratosphere VLT filtered radiometric images of Uranus at 13.2 μm, sensing stratospheric emission from C2H2. VLT filtered radiometric images of Uranus at 18.7 μm, sensitive to tropospheres.
Ahot spot near Neptune’s southern pole was discovered (Orton et al. 2012). • The spatial variability is strongly tied to the atmospheric dynamics, such as the vertical propagation of waves from the troposphere to the stratosphere. • The observations would constrain the properties of the waves, as well as the background states for wave propagation, for instance, the atmospheric stratification. Neptune: observations Image of Neptune in CH4 emission at 7.9 μm, taken with VISIR at the VLT.
Uranus: 97 degree obliquity Uranus and Neptune: Seasonal cycle
TMT gives unprecedented opportunity to retrieve the abundance of multiple species simultaneously over a wide spectral range. • TMT can be used to study the detailed structures of the distinctive features on giant planets, such as the Great Red Spot (GRS) and white ovals, as well as their temporal variability. • TMT can be used to monitor and characterize the long term variability on giant planets. • The observations from TMT would provide important clues for understanding the similarities and differences in atmospheric dynamics and chemistry among the giant planets. Conclusions