Download
1 / 10
100 likes | 215 Vues
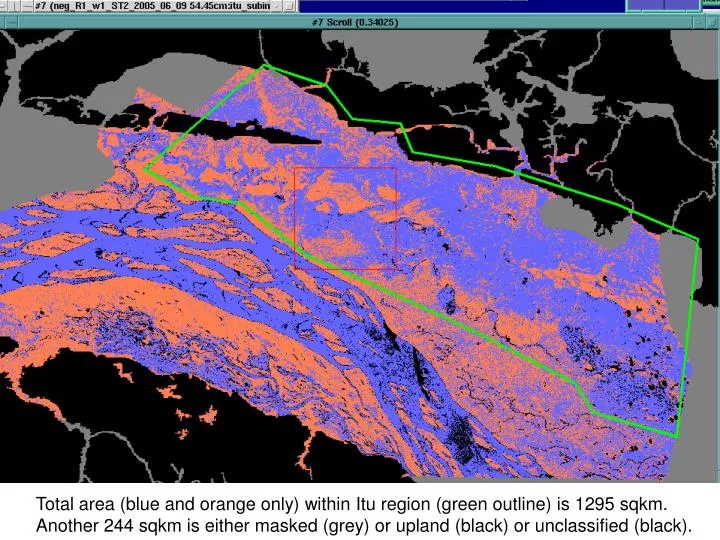
Total area (blue and orange only) within Itu region (green outline) is 1295 sqkm. Another 244 sqkm is either masked (grey) or upland (black) or unclassified (black). Total area (excluding grey and black) within Itu region (green outline) is 1295 sqkm.

E N D
Total area (blue and orange only) within Itu region (green outline) is 1295 sqkm. Another 244 sqkm is either masked (grey) or upland (black) or unclassified (black).
Total area (excluding grey and black) within Itu region (green outline) is 1295 sqkm. Another 244 sqkm is either masked (grey) or upland (black) or unclassified (black).
Floodmaps are in floodmap_4clas_Itu_th0p2.img 24 bands 4 colors: black is unclass or upland grey is masked blue is flooded orange is unflooded Classification is in s1_sam_supersize_to_r1_byte_masked.img Radarsat is in pixag_4to1_24dates_itu-subimg_v1.img Wetmask is in wetmask_25m_UTM_itu.img All in dir LBA24/RADARSAT/neg/neg_w_f450/sig/classif/flood/thresh/
Data table Results of simple floodmap area statistics
Example where Itu region is crudely outlined and may contain Rio Negro floodplain.
Depth at the Itu gauge, in cm, versus dates. Flooded area in sq km and area fraction are listed for each date.
Fraction of area mapped as flooded versus dates. Flooded area in sq km and Itu depth gauge in cm are listed for each date.