Download
1 / 37
370 likes | 484 Vues
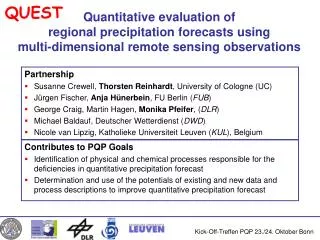
Exploring QUEST Mortality. Understanding the Baseline Data and Using Clinical Advisor and Quality Manger to Create Actionable Hypotheses for Intervention. Eugene Kroch, Ph.D., Vice President and Chief Scientist Richard A Bankowitz, MD MBA FACP, Vice President and Medical Director. Topics.

E N D
Exploring QUEST Mortality Understanding the Baseline Data and Using Clinical Advisor and Quality Manger to Create Actionable Hypotheses for Intervention Eugene Kroch, Ph.D., Vice President and Chief Scientist Richard A Bankowitz, MD MBA FACP, Vice President and Medical Director
Topics • Baseline reports • Model comparison • Variation across hospitals • Size effects • Trending • Two-year time frame • General trends • Trend ranges and volatility • Palliative care patterns • Exploring Potential Drivers of Mortality using Clinical Advisor or Quality Manager
QUEST Mortality Measure Observed Actual Observed Actual Index O/E Ratio = = Expected Predicted Expected Predicted Expected Predicted Index > 1: Actual mortality isgreaterthan predicted (opportunity) Index < 1: Actual mortality islessthan predicted
Measuring Risk (alternatives) APR-DRG Severity Classification CareScience Risk Prediction • Clinical • Principal Diagnosis (terminal digit) • Severity Weighted Comorbidities • Procedures • Urgency of Admission • Neonatal Birth Weight • Demographic • Age, Gender • Household Income • Facility Type • Race • Discharge Disposition Referral and Selection • Admission Source (e.g Transfer in) • Payor Class • Travel Distance • Facility Type • Base APR-DRG • Age • Gender • Discharge status • Diagnoses • Procedures • Birth weight • 4 Levels of: • Severity (resource demand) • Risk of mortality
1 2 3 4 Illustration of Precision Under APR-DRGs patient 2 is lumped together with Patient 1, even though under continuous severity scaling patient 2 is more like patient 3. APR-DRG severity buckets Patient 1 Patient 3 Patient 2 CareScience continuum Continuous Severity Scale Patient 1 Patient 3 Patient 2
Baseline O/E Variation across Hospitals • Baseline: 161 hospitals – 2006q3 to 2007q2 • CareScience and APR-DRGs are very close (next slide) • Cross hospital range = 0.50 to 2.00 • All 12 hospitals with O/E ratios > 1.35 are relatively small (smallest third in size) • Not so for 16 hospitals with O/E ratios < 0.65
Baseline Comparison of O/E Ratios Correlation = 94%
Baseline Distribution of O/E Ratios Smaller hospitals
O/E Trends • 8 quarters: 2005q3 to 2007q2 • Overall pattern • O/E ratio falls by about 12% over the 8 quarters • Trend range • For 4-quarter moving averages • 40% decline to 20% increase • Volatility • Time volatility is inversely related to size (correlation is about -50%) • Quarter-on-quarter O/E changes greater than 0.4 are concentrated in smaller hospitals (<1000 disch. per qtr.).
Overall Trend over 8 Quarters Moving Avg Mean O/E ratio has fallen about 12%
Strong Mortality Declines Note Bapt Mem
Distribution of Palliative Care Coding Half of hospitals have less than 2 per thousand
Palliative Care Mortality Distribution Mean = 53%
QUEST Mortality Drill Down Report to be Released End of April
Exploring Drivers of Mortality • Goal • Explore in-patient mortality by finding ACTIONABLE clusters – IE patient cohorts in which mortality rates might be improved with an intervention (Part of a PDCA cycle) • Common cause – systemic problems • Special cause – isolated but important causes • Definition • Excess Deaths = Total deaths in excess of predicted by the risk adjustment model = (obs % - exp %) * N patients • Excess Deaths can be “negative” in this definition • Therefore sum of all non-negative Excess Deaths over all patient subsets will be greater than hospital-wide results (hospital-wide obs – hospital-wide exp) * Total Discharges • In other words, there are always pockets of opportunity • Approach • Use CA or QM to determine excess death by categories • Admission Source, Age, Principal Dx, APR-DRG or DRG, severity, other
A Tale of Two Hospitals • Two Sample Hospitals • Hospital 1: > 375 beds, non-teaching, urban, o/e < 1.00, 2nd Qrtle • Hospital 2: < 375 beds, non-teaching, urban, o/e > 1.00, 3rd Qrtle • Questions • What conditions are associated with excess mortality across the entire hospital population? Conditions can be primary or secondary conditions (e.g., sepsis is not always coded as primary diagnosis) • Is there evidence for special cause or common cause variation by common groupings? • Admission source, care progression, age, principal dx, etc. • Goal • Determine top three or four focus areas in which to implement PDCA cycles to improve in-patient mortality
Hospital 1: Excess Death by Admit Source – Aggregate Notice the hospital-wide o/e is < 1.00 and very close to TPT NO Excess Deaths by any given admission source No evidence of special cause variation at hospital-wide level Source: Clinical Advisory Quality Reports with Excess Deaths added - see Appendix
Hospital 1: Excess Deaths by Age Group – Aggregate Level Possible special cause variation in patients over 84 years old Source: Clinical Advisory Quality Reports with Excess Deaths added - see Appendix
Hospital 1: Excess Mortality by Primary Dx Hospital-Wide Excess Deaths (partial) sorted by excess deaths Remember this hospital has an O/E = 0.88. However, there are still many pockets of opportunity. Nine Excess Deaths with Sepsis as Primary Dx Source: Clinical Advisory Quality Reports with Excess Deaths added - see Appendix
Hosp 1: Excess Mortality by ICD9 Secondary DxHotpital- Wide Excess Deaths (partial) – sorted by Excess Deaths Expected Rate Notice: 1) Observed and expected mortality for Palliative Care Notice: 2) Many other pockets of opportunity – (note these are not mutually exclusive patients) Source: Clinical Advisory Quality Reports with Excess Deaths added - see Appendix
Hosp 1: Excess Mortality by ICD9 Secondary DxHospital- Wide Excess Deaths (partial) – sorted by Clinical Categories Notice: Grouping Excess Deaths into meaningful categories may help opportunities stand out Source: Clinical Advisory Quality Reports with Excess Deaths and Clinical Categories added, Clinical Categories are user defined- see Appendix
Hosp 2: Excess MortalityPareto Analysis by Admit Source (all admits) Evidence of special cause variation in patients by admit source. Almost all Excess Deaths are from two sources Source: Clinical Advisory Quality Reports with Excess Deaths and Clinical Categories added, Clinical Categories are user defined- see Appendix
Hospital 2: Excess Mortality- ED AdmissionsPareto Analysis (partial) by Excess Deaths Clinical Category Sources of ED mortality: Respiratory, Stroke, Renal, Sepsis, and “Low Mortality Populations” Source: Clinical Advisory Quality Reports with Excess Deaths and Clinical Categories added, Clinical Categories are user defined The category “Low mortality population is based upon the APRDRG expected mortality. “Low Mortality” and “End of Life Care” are arbitrarily defined, not clinically determined, and are intended to aid analysis only- see Appendix
Hospital 2: Excess Mortality – Transfer from hospPareto Analysis (partial) by Excess Deaths Clinical Category Sources of Transfer Patient mortality: ? End of life issues Source: Clinical Advisory Quality Reports with Excess Deaths and Clinical Categories added, Clinical Categories are user defined The category “Low mortality population is based upon the APRDRG expected mortality. “Low Mortality” and “End of Life Care” are arbitrarily defined, not clinically determined, and are intended to aid analysis only- see Appendix
Hosp 2: Excess Mortality by ICD9 DX – ALL DxDx with more than 5 Excess Deaths – grouped by category (Xcess > 5 deaths) Clinical Category Source: Clinical Advisory Quality Reports with Excess Deaths and Clinical Categories added, Clinical Categories are user defined The category “Low mortality population is based upon the APRDRG expected mortality. “Low Mortality” and “End of Life Care” are arbitrarily defined, not clinically determined, and are intended to aid analysis only- see Appendix
Approaching Drivers of Mortality *Illustrative Examples of Potential Secondary Drivers Potential PRIMARY DRIVERS Potential SECONDARY DRIVERS GOAL Early appropriate level of care (ICU) Sepsis Early recognition and intervention Timely transfer toICU Elderly and other high risk groups Hospital – Level Risk Adjusted Mortality (O/E Ratio) Respiratory Conditions Early recognition of resp compromise Avoidance of VAP Post operative resp care protocols Cardiac Related and Shock Rapid response team Adherence to ACC Protocols Early transfer to ICU if needed Improved use of cardiac monitors End of Life Care Early identification of patients *Data mining to examine top drivers of mortality is currently in progress Proper use of V667 palliative code Appropriate setting: hospice v acute
QUESTIONS? Eugene A. Kroch Richard A. Bankowitz
APR-DRG Process Flow Step 1 Step 2 Step 3 NB: Risk code is mapped into mortality risk based on the mortality rates from calibration data base.
= 0.074 From CS client base sample CareScience Regression Model Principal Dx – Pneumonia –one of 142 disease strata Outcome = age + sex + distance + proc + …... 1.0 - 0.9 - 0.8 - 0.7 - 0.6 - 0.5 - 0.4 - 0.3 - 0.2 - 0.1 - ** * * * * * * * * * * * * * * * * * * * | | | | | | | | | 10 20 30 40 50 60 70 80 90 age Y = 0 + 1X1 + 2X2 + … + nXn dependent variableindependent variables / explanatory variables
Trend Distribution across Hospitals Mean = -12%
Trend Volatility Smaller hospitals (avg 25% of mean size)
Appendix: How were the Excess Death Tables Made? • Hospital 1: Excess Death by Admit Source • CA Quality Reports > Mortality Reports > Select QUEST time period > Select Patient Type Inpatient > Drill by Admit Source > Export to Excel • Add column Excess Death (Mortality – Expected Mortality)* Cases • Sort by Excess Death • Hospital 1: Excess Death by Age Group • CA Quality Reports > Mortality Reports > Select QUEST time period > Select Patient Type = Inpatient > Drill by Detailed Age Categories > Export to Excel • Add column Excess Death (Mortality – Expected Mortality)* Cases • Sort by Excess Death • Hospital 1: Excess Death by Primary Dx • CA Quality Reports > Mortality Reports > Select QUEST time period > Select Patient Type Inpatient Drill by Principal Dx > ICD9 > Export to Excel • Add column Excess Death (Mortality – Expected Mortality)* Cases • Sort by Excess Death • Hospital 1 Excess Death by Secondary Dx – Sort by Excess Death • CA Quality Reports > Mortality Reports > Select QUEST time period > Select Patient Type Inpatient Drill by Secondary Dx > ICD9 > Export to Excel • Add column Excess Death (Mortality – Expected Mortality)* Cases • Sort by Excess Death • Hospital 1 Excess Death by Secondary Dx – Sort by Clinical Grouping • CA Quality Reports > Mortality Reports > Select QUEST time period > Select Patient Type Inpatient Drill by Secondary Dx > ICD9 > Export to Excel • Add column Excess Death (Mortality – Expected Mortality)* Cases • Sort by Excess Death • Assign categories to the top source of Excess Death – any grouping that is clinical useful will do • Resort by the categories • You may color if you like to enhance visual communication Note: All Clinical Categories are user defined and are arbitrary, The category “Low mortality population is based upon the APRDRG expected mortality. “Low Mortality” and “End of Life Care” are arbitrarily defined, not clinically determined, and are intended to aid analysis only. They are not intended as a substitute for clinical judgment.