Download
1 / 33
330 likes | 478 Vues
Lecture 1: Tue, Jan 14. Introduction/Syllabus ( web page ) Some useful guidelines Course Outline Review (Ch 9,10) Key Statistical Concepts Sampling Distributions Confidence Intervals & Inference JMP-IN. Guidelines. Lectures Daily Reading – Even Numbered Problems.

E N D
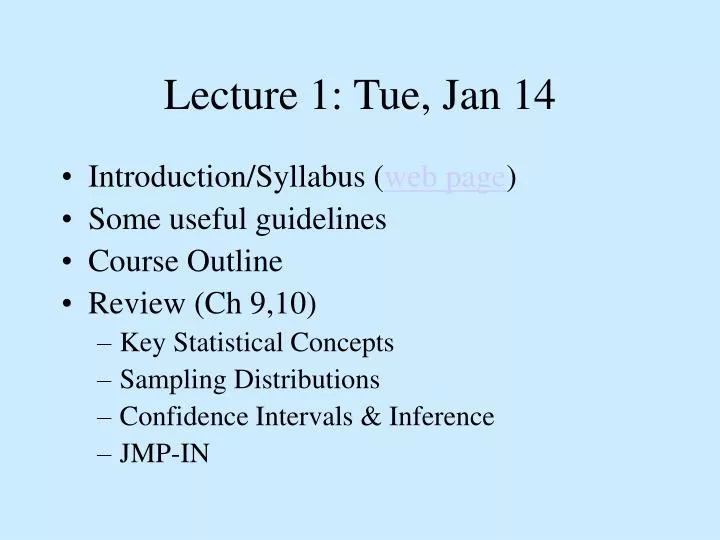
Lecture 1: Tue, Jan 14 • Introduction/Syllabus (web page) • Some useful guidelines • Course Outline • Review (Ch 9,10) • Key Statistical Concepts • Sampling Distributions • Confidence Intervals & Inference • JMP-IN
Guidelines • Lectures • Daily Reading – Even Numbered Problems. • Always try to relate new concepts to existing examples • Solutions to examples will be provided in class. • All lectures can be downloaded off the course website. (Click on the lecture schedule and click on the date to obtain the lecture) • Print outs of lectures will not be provided by the instructor. • All necessary JMP instructions for the assignments will be provided in class, or available through the JMP help link in the course website.
Guidelines (Contd.) • Assignments and Exams • A typical exam and/or assignment will have 60-70% straightforward material, along with 30-40% of “harder” material. • Each assignment will be worth 10 pts and all problems will be graded. • Total of 7-8 assignments • All assignments will typically be due a week from the date they are assigned.
Guidelines (Contd.) • All assignments and exams are cumulative in some sense (For example: You could be asked to construct confidence intervals (Ch10,12,13) for the estimate of the slope (Ch 18,19,20)). • Assignments and exams not collected will be kept outside the instructor’s office. • The instructor’s office hours are primarily meant for addressing conceptual issues. For homework related questions students are encouraged to use the TA’s office hours and Statlab hours.
Guidelines (Contd.) • JMP-IN • Used extensively for assignments • Familiarity with outputs for exams • Recommended JMP-IN text is good reference • Other general guidelines • Feedback on lecture style, assignments, office hours are encouraged. • Constant interaction encouraged to better understand material.
Guidelines (Contd.) • All re-grade requests (neatly written) should be handed to the instructor on or before the due date. • Communications via email should be used only in case of emergencies, for appointments, and short questions. • Only a tentative guideline of the exam format will be provided before the exams.
Guidelines (Contd.) • The final grade is determined based on the assignments, midterms, and the final. No other “special” work/projects can be used as supplements. • These guidelines, rules for the course, can be changed at any time by the instructor.
Guidelines (Contd.) • Preparation for exams • Work on lectures • The book (remember you are required to have one – the red thing) • Work on assignments • Lastly, work on the practice exams (without looking at the solutions)
Statistics 102 • Basic Idea of Statistics • To make inferences about a population using data from only a sample Population inference about population (using statistical tools) Sample of Data
Some of the types of questions you’ll be able to answer by the end of this course • Estimates • What is the average life of an Energizer AA battery? • How many chocolate chips in a box of Chips Ahoy cookies on average? • Do you really get 15 minutes worth of parking for every quarter you put in a parking meter? • Comparisons • Do name-brand batteries work better than genetics? • Does garlic reduce cholesterol more than a placebo? • Relationships • What are the most useful predictors of success in college? • What is the relationship between income and years of education • Is winning the Publisher’s Clearinghouse Sweepstakes independent of whether you buy their magazines?
Brief Course Outline • Brief Review of Stat 101 • As we go along we will review what we need, but you should be familiar with • Mean, standard deviation, percentiles, histograms, boxplots, normal distribution, t-distribution, binomial distribution, sampling distribution of a statistic, confidence interval • Tests of Hypotheses • One sample tests • e.g., Does a bag of Chips Ahoy contain an average of at least 1000 chips? • e.g., Is the probability of winning a free coke (“look under the cap”) really 1/6? • Two sample tests • e.g., Is it more profitable to offer credit card holders frequent flyer miles or 1% cashback? • Analysis of Variance • (comparison of more than 2 groups) • Do sales of a grocery product depend on what shelf it is placed on (e.g., bottom, middle or top shelf)? • Out of three possible packages, which do consumers prefer?
Linear Regression • Studies the relationship between variables, specifically the association between one or more predictor variables and an outcome variable • e.g., How is salary related to years of experience, education, performance measures, gender, supervisory responsiblities, etc.? • e.g., How are car insurance rates related to your driving history, age, gender, geographical location, type of car, driver’s education? • Time Series • To detect patterns or trend over time • Given the number of cable TV subscriptions over the past 10 years, can you predict demand for cable TV next year? • Can you estimate the seasonal fluctuation in demand for hotel rooms in order to plan your staffing accordingly? • Chi-Square tests for qualitative data • e.g., Is educational background associated with smoking status? • e.g., Is your chance of getting hired as a computer programmer independent of your age? (age discrimination) or gender? (gender discrimination) • e.g., Is the use of aluminum-containing antacids associated with Alzheimer’s disease?
Key Statistical Concepts • Statistics: the art of data analysis. Involves classifying, summarizing, organizing, and interpreting numerical information. • Population: the set of all items of interest in a statistical problem. • Sample: a subset of items in the population. • Descriptive Statistics: a body of methods used to summarize and organize the characteristics of sample data. • Inferential Statistics: a body of methods used to draw inferences about characteristics of populations based on sample data.
Variable: characteristic or property of an individual item of a population or sample. • Observation: the value assigned to a variable. • Parameter: descriptive measure of a population. • Statistic: descriptive measure of a sample. • Statistical Inference: process of making an estimate, prediction or decision about a population based on information contained in a sample. • Measure of Reliability: a statement about the degree of uncertainty.
Example: Cola Wars • “Cola wars” is the popular term for the intense competition between Coca-Cola and Pepsi displayed in their marketing campaigns. Their campaigns have featured movie and television stars, rock videos, athletic endorsements, and claims of consumer preference based on taste tests. Suppose, as part of a Pepsi marketing campaign, 1,000 cola consumers are given a blind taste test (ie, a taste test in which the two brand names are disguised). Each consumer is asked to state their gender, age and a preference for brand A or brand B.
Answers to Key Questions a. Population of interest: the collection or set of all cola consumers. b. Variables of interest: gender, age and cola preference. c. Sample: 1,000 cola consumers selected from the population of all cola consumers. d. Inference of interest: generalization of the cola preferences of the 1,000 sampled consumers to the population of all cola consumers. In particular, the preferences of the consumers in the sample can be used to estimate the percentage of all cola consumers who prefer each brand.
e. When the preferences of 1,000 consumers who are used to estimate the preference of all consumers in the region, the estimate will not exactly mirror the preferences of the population. For example, if the taste test shows that 56% of the 1,000 consumers chose Pepsi, it does not follow (nor is it likely) that exactly 56% of all cola drinkers in the region prefer Pepsi. Nevertheless, we can use sound statistical reasoning to ensure that our sampling procedure will generate estimates that are almost certainly within a specified limit of the true percentage of all consumers who prefer Pepsi. For example, such reasoning might assure us that the estimate of the preference for Pepsi from the sample is almost certainly within 5% of the actual population preference. The implication is that the actual preference for Pepsi is between 51% [ie, (56-5)%] and 61% [ie, (56+5)%]- that is, (56 5)% This interval represents a measure of reliability for the inference.
Sampling Distributions • Two widely used formulas from Stat101 are
Central Limit Theorem for the Sample Mean If a random sample is drawn from any population: 1) The sampling distribution of the sample mean is approximately normal for sufficiently large sample size. 2) The larger the sample size, the more the sampling distribution of will resemble a normal distribution.
How large should n be? In general, the sample size required to apply the Central Limit Theorem depends on the population distribution. But, as a rule of thumb, many people (including the book) use the minimum sample size of n=30.
Sampling Distribution of a Proportion The mean, variance and SD of p-hat are: So, the variable is approximately a standard normal RV.
Confidence Intervals • Confidence interval estimates provide a range of plausible values for the unknown parameter. • Before the experiment, the probability that a confidence interval will cover the true parameter value is • After the experiment, we say that, with confidence, the interval covers the true parameter value. Equivalently, if we repeat our experiment over and over, and construct 95% confidence intervals each time, we would expect about 95% of the intervals to cover the “true” value of the mean.
For a sample from a normal population for which the SD is known, a C.I. for the mean is given by: • This C.I. for the mean is approximately valid for large samples even if the population is not normal because of the central limit theorem
Components of a Confidence Interval LCL UCL width
Information and Confidence Intervals • Small interval more information. • Larger interval less information.
Inference using Confidence Intervals 1) Assume a particular value for mu. 2) Collect data & construct confidence interval 3) If the hypothesized value of mu is not contained in the interval evidence that the value is incorrect. C.I.
Exercise 10.24 • A statistics professor is investigating how many classes university students miss each semester. To answer this question, she took a random sample of 100 students and asked them how many classes they had missed in the previous semester. • Estimate the mean number of classes missed by all students at the university. Use a 99% confidence level and assume that the population SD is known to be 2.2 classes.
Given: • The 99% confidence interval is:
Sampling and Nonsampling Errors (Chapter 5) • Sampling error: differences between sample statistic and population parameter due to sampling fluctuations (average amount of sampling error measured by variability of a statistic) • Nonsampling error: mistakes made in acquisition of data or due to sample not being representative of the target population (average amount of nonsampling error measured by bias of a statistic) • Statistical inference, e.g., a confidence interval, accounts for sampling error but not for nonsampling error
Should the United Nations continue to have its headquarters in the United States? • A television program asked its viewers to call in with their opinions on this question. There were 186,000 callers, 67% of whom said “No.” • A nationwide random sample of 500 adults found that 72% answered “Yes” to the same question. • Which answer do you think is more reliable?
Take Away • Be comfortable with topics from Stat101 • Sampling Distributions • Confidence Intervals (sigma known) • Inference using sampling distributions and CI • Use of z-tables, t, F, Chi Squared. • Basic JMP-IN (opening data files, descriptive statistics) • Reading – Ch 11, 12.