Download
1 / 10
100 likes | 204 Vues
p 0 v 2 analysis in s NN = 200GeV Au+Au collisions. KANETA, Masashi for the PHENIX Collaboration RIKEN-BNL Research Center. Why Event Anisotropy?. z. y. x. Because of sensitive to collision geometry At low p T (<2 GeV/c) Pressure gradient of early stage

E N D
p0 v2 analysisin sNN = 200GeV Au+Au collisions KANETA, Masashi for the PHENIX Collaboration RIKEN-BNL Research Center Masashi Kaneta, RBRC, BNL The Physical Society of Japan, 2003 Autumn Meeting in Miyazaki, Japan (2003/09/11)
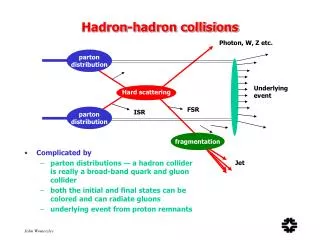
Why Event Anisotropy? z y x • Because of sensitive to collision geometry • At low pT (<2 GeV/c) • Pressure gradient of early stage • Hydrodynamical picture is established • At high pT (>2 GeV/c) • Energy loss in dense medium (Jet Quenching) • Partonic flow(?) Here we focus on ellipticity of azimuthal momentum distribution, v2 (second Fourier coefficient) as physics message Masashi Kaneta, RBRC, BNL The Physical Society of Japan, 2003 Autumn Meeting in Miyazaki, Japan (2003/09/11)
PHENIX experiment • Lead Scintillator and Lead Glass EMCs • Gamma measurement (p0gg) • BBCs and ZDCs • Collision centrality determination • BBCs • Reaction plane determination and • Its resolution correction Masashi Kaneta, RBRC, BNL The Physical Society of Japan, 2003 Autumn Meeting in Miyazaki, Japan (2003/09/11)
Method of p0 v2 Measurement • Define reaction plane by charged multiplicity on Beam-Beam Counters • p0 reconstruction from Electro-Magnetic Calorimeter (EMC) • For each pT, azimuthal angle, centrality • Combine both information • Counting number of p0 as a function of event anisotropy parameter measured reaction plane angle azimuthal angle of the particle vnreal = vnmeasured/ (reaction plane resolution)n Note: the detail of reaction plane definition will be found in nucl-ex/0305013 Masashi Kaneta, RBRC, BNL The Physical Society of Japan, 2003 Autumn Meeting in Miyazaki, Japan (2003/09/11)
Some example plots from an analysis procedure Invariant mass of gg from same event and mixed event After subtraction, there is 2nd component of B.G. in pT<2GeV/c region 200GeV Au+Au normalization range for combinatorial B.G. subtraction shape assumed as linear+asym. Gauss mgg [GeV/c2] mgg [GeV/c2] count number of p0 in a range after 2nd B.G. subtraction (not used the fit function) Fit function: (average of p0 count) ( 1 + 2 v2 cos[2(f - FR)]) Green lines : deviation by error of v2 f-FR [rad] Masashi Kaneta, RBRC, BNL The Physical Society of Japan, 2003 Autumn Meeting in Miyazaki, Japan (2003/09/11)
Tooooo many histograms checked Example of invariant mass distributions for each pT, f-FR in a centrality bin Before combinatorial background subtraction After combinatorial background subtraction Masashi Kaneta, RBRC, BNL The Physical Society of Japan, 2003 Autumn Meeting in Miyazaki, Japan (2003/09/11)
v2 vs. pT vs. Centrality from 200GeV Au+Au Charged p+K v2 consistent with p0v2 in pT<4GeV/c The charged p and K v2 are shown only with statistical errors phenix preliminary phenix preliminary }nucl-ex/0305013 Statistical error is shown by error bar Systematic error from p0 count method and reaction plane determination is shown by gray box Masashi Kaneta, RBRC, BNL The Physical Society of Japan, 2003 Autumn Meeting in Miyazaki, Japan (2003/09/11)
v2 vs. pT (Minimum Bias) from 200GeV Au+Au phenix preliminary }nucl-ex/0305013 phenix preliminary phenix preliminary nucl-ex/0305013 • Identified particle v2 up to pT=10GeV/c Masashi Kaneta, RBRC, BNL The Physical Society of Japan, 2003 Autumn Meeting in Miyazaki, Japan (2003/09/11)
Comparison with a model Special thanks to C. Nonaka (one of authors) of nucl-th/0306027 for data of model calculation Comparison with a model which is described in nucl-th/0306027. Here we don't want to discuss which model can describe the data. To conclude which model can describe the data, we need much more statistics in high pT region. phenix preliminary Masashi Kaneta, RBRC, BNL The Physical Society of Japan, 2003 Autumn Meeting in Miyazaki, Japan (2003/09/11)
Summary • First measurement of p0 v2 at RHIC • In pT=1-10 GeV/c • Charged p+K v2 consistent with p0v2 • In pT=1-4GeV/c • Minimum bias data shows finitep0v2 • Up topT~8 GeV/c • RHIC run4 Au+Au, it will be • Much more statistics • Detail study of v2 shape around pT=2-4GeV/c • Much higher pT • We want to know where is end of finite v2 in very high pT Masashi Kaneta, RBRC, BNL The Physical Society of Japan, 2003 Autumn Meeting in Miyazaki, Japan (2003/09/11)