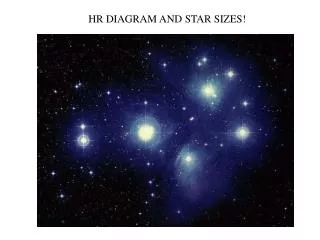
Download
1 / 16
160 likes | 168 Vues
CAPSTONE Lecture 6 HR Diagram. Two stars at distances d 1 and d 2 with intrinsic total luminosities L 1 and L 2 . (L=4 p r 2 s T 4 ). Flux, f , is ergs per cm squared per second over some frequency interval is received at Earth.

E N D
CAPSTONE Lecture 6 HR Diagram CAPSTONE.Lect.6.HR diagram
Two stars at distances d1 and d2 with intrinsic total • luminosities L1 and L2. (L=4pr2sT4). • Flux, f, is ergs per cm squared per second over some • frequency interval is received at Earth. • f1=L1/(4d12), f2=L2 /(4d22) (1) • If L1=L2, then f1/f2=4d22/4d12 (2) • Take the log of both sides • Multiply both sides by -2.5 • -2.5 log f1 +2.5 log f2=-2.5 (2 log d2) + 2.5 (2 log d1) CAPSTONE.Lect.6.HR diagram
Note on parallax • Draw parallax diagram. • One parsec is the distance of a star that shows a parallax motion of 1 arcsec (1/2 angle, back and forth each year) • If a star shows only ½ arcsec parallax (called p), it must be twice as far away. • If a star shows only 0.1 arcsec parallax, it is 10 pc away. • So, d(pc) = 1/p(arcsec) CAPSTONE.Lect.6.HR diagram
Finally, define a reference distance, 10 pc, which is to be the absolute magnitude (M), an intrinsic property of the star. • Take star 2 to be at 10 pc. (Hence, log d2=1.) And, let m1=m, m2=M. Then, • m-M=5 log d1 –5 (3) • This equation is called the magnitude equation • -2.5 log f1 +2.5 log f2=-2.5 (2 log d2) + 2.5 (2 log d1) • Define m= - 2.5 log f • m1-m2=5 log d1- 5 log d2. CAPSTONE.Lect.6.HR diagram
Stars of given type of spectrum and the same colors have the same absolute magnitude (99.9%) • Stars have different apparent magnitudes depending on their distance. • Stars behind dust clouds look redder than they • are intrinsically, so… • m-M=5 log d1 –5+ A(l) • (i.e., the star looks fainter) CAPSTONE.Lect.6.HR diagram
The equation only makes sense if we agree to measure all stars in a certain way, for instance, using a filter to define exactly the wavelengths of light included in the quoted magnitude. For instance, a filter often used by astronomers, known as the V filter, covers the region from 5100 A to 5900 A. Since the filter is called the V filter, the magnitudes of stars so measured are denoted with the subscript V on both m and M. Other filters are the B filter, the U filter, the R filter, etc. The main filter system today is denoted as u, g, r, i, z, reflecting slight differences in the wavelengths passed. • It is handy to memorize the differences in brightness for magnitude differences of 1,2, 2.5, 3, 4 and 5. The relative luminosities are 2.5, 6.25, 10, 15, 40 and 100. CAPSTONE.Lect.6.HR diagram
Hertzsprung Russell Diagram • Stars have color • U, B, V; u, g, r, i, z • Color is determined by measuring an apparent magnitude in a blue filter, say, then a red filter and taking the difference. Bluer stars have negative B-R values (called “color”). • Since mB-MB=5log r -5 for a given star at given distance • and mV-MV=5log r -5 • mB-MB=mV-MV or mB-mV=MB-MV (called “color”) • That is, we can know the color of a star without knowing the distance. • Colors are easy to measure, distances are hard. CAPSTONE.Lect.6.HR diagram
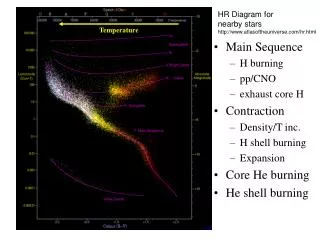
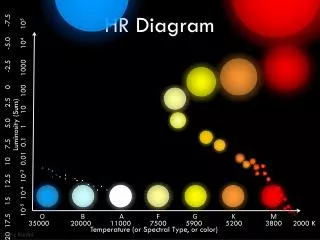
Order from chaos • Around 1890, spectra of thousands of stars were obtained and it was recognized that there were only a few types. • Around 1923, it was found that, while a diagram of apparent mag. Vs. spectral type (temperature) was a scatter diagram • If the absolute magnitude was used, the diagram was very ordered. Something physical had been discovered about stars, that was understood over the next 40 years. We will do spectral types in the next lecture. CAPSTONE.Lect.6.HR diagram
The diagram • Hot, massive stars end up in the upper left; cool, low mass stars end up in the lower right. • In addition, there are poorly populated areas. One, in the lower left, is populated by hot, very tiny stars (white dwarfs). Another, in the upper right, is populated by giant stars on the giant branch (perpendicular to the main sequence, rising to the upper right). A band runs across the top of the diagram, called the horizontal branch. Other, higher, horizontal bands, populated by supergiants, exist at the top of the HR diagram. • Using color or temperature, one axis is completely independent of distance. The other (vertical) axis can be made independent of distance by using absolute magnitudes. This left the job of explaining why stars resided in different places, but at least the pattern that all agreed on made it clear that the quest would be worth while. CAPSTONE.Lect.6.HR diagram
….more • O stars have B-V=-0.3 (that is, they are 0.3 magnitudes brighter in the B filter than the V filter. (Remember, brighter objects, in astronomical notation, are labelled with more and more negative absolute magnitudes. Stars known as A stars have B-V=0.0. G stars have B-V=0.6. M stars have B-V>1.5 (brighter in the red than in the blue.) • The dearth of stars in parts of the diagram meant that stars had different ages; some evolved faster than others. • How old are the stars? CAPSTONE.Lect.6.HR diagram
Age of Earth(I gave these points earlier) • The Biblical age of the Earth (Bishop Usher, circa 1825) is about 6000 years, the span of recorded history. Darwin suggested that the age had to be 600,000,000 years, to allow time for species to evolve under the laws he called natural selection. (He figured this out, among other ways, by thinking about how farmer’s raised cattle to have different characteristics.) CAPSTONE.Lect.6.HR diagram
The rapid change • There was a raging debate between Darwin and his followers, on the one hand, and the physical scientists, on the other, about the age of the Earth. The latter, using the Kelvin Helmholtz time scale (1860)(see next lecture), argued that the Earth was 30 million years old, 5% of the age Darwin gave. However, by 1897, radioactivity was discovered (Madame Curie and J. Bequerel). It was quickly realized that the Earth could be kept warm much longer than Kelvin assumed by assuming the Earth was just cooling off from its formation. By 1926, the accepted radioactive age of the Earth was 4.5 billion years, much longer than either Kelvin or Darwin has argued for. CAPSTONE.Lect.6.HR diagram
Implications • This realization meant that the Sun had to be very old, since the Sun must be older than Earth. Otherwise, the oceans would have frozen over and not melted. (We know today that stars such as the Sun do not change brightness significantly over their lifetimes, otherwise the HR diagram would have a broader locus of points on the main sequence.) CAPSTONE.Lect.6.HR diagram